Conventional investing wisdom says that investing in stocks is riskier than investing in bonds. In fact, the percentage allocation of a portfolio to stocks vs bonds is usually determined by the investor’s risk tolerance. Conservative portfolios typically have more bond holdings than stocks and more aggressive portfolios are usually more heavily weighted with stocks.
What Is Risk?
Although there are many possible definitions of risk, for the purposes of this discussion we will define risk as the probability of an investment loosing it’s value. For example, if today you invested $10,000 what is the probability that tomorrow or the day after that your investment is only worth $5,000 ? This definition is consistent with the conventional investing approach to risk management. Using this definition and based on the observation that typically stocks tend to be more volatile in the short term then bonds, stocks are deemed a riskier investment than bonds. The same observation can be extended to aggregates of stocks such as ETFs and the stock market in general.
In previous posts such as Saving For Retirement we talked about the potential returns of an investment in the S&P 500, the latter constituting the benchmark of the US stock market. Let’s now have a better look at the other side of the coin. What is the potential downside of an investment in the S&P 500?
Quantifying Risk
Just like we did in the post Past Performance Is NOT Indicative Of Future Results we will look at a ten and also at a twenty five year investment in the S&P 500. Using S&P 500 data going back to 1950, we have a look at what would have happened had we invested some monies and held them for a 10 or 25 year period. We will look at the results for each day between 1950 and the present.
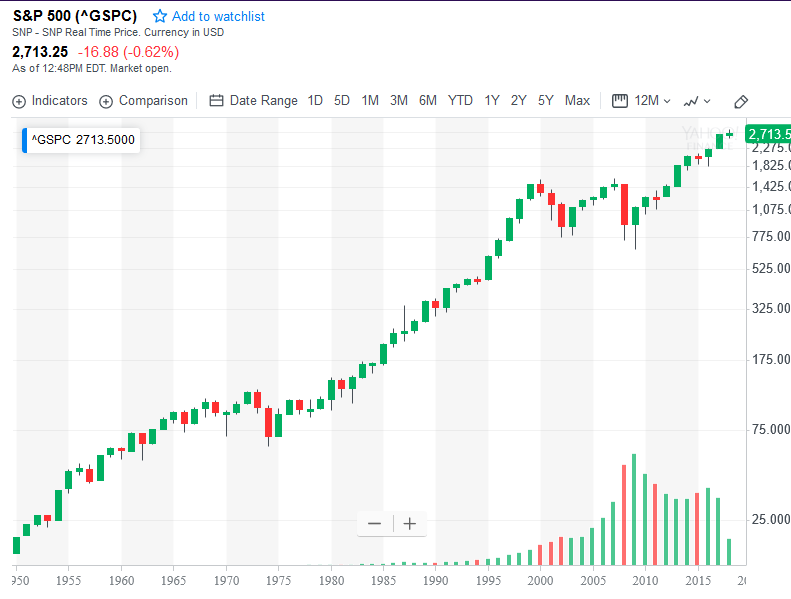
Stock market prices fluctuate every day. Small changes up and down are not of much concern to us. What we are really interested is the worst case scenario. How much money in total can we potentially be down? We can get an estimate of this by computing the probability of the maximum drawdown. To do so we first compute all the maximum drawdowns or peak-to-trough declines during the historical period of interest. Once these are known, we then compute the probability of occurrence.
Looking at ten and twenty five year holding periods we find that the probabilities of experiencing a drawdown of at least -5%, -10%, -20% and -50% are as follows:
| 10 Yr Hold | 25 Yr Hold | |
| Drawdown | Probability | Probability |
| -5.00% | 100.00% | 100.00% |
| -10.00% | 100.00% | 100.00% |
| -20.00% | 93.94% | 100.00% |
| -50.00% | 15.69% | 21.11% |
The above table shows that all the people who made a 10 or a 25 year investment between 1950 and 2017, had a drawdown that was at least -10.00%. Those unlucky ones who were in the market in 2008 experienced a drop in their portfolio of more than -50.00%.
Loss Recovery
If we look at all the drawdowns where the S&P 500 fell by -5% or more we observe the following:
| Drawdown | Drop | Recovery | Ratio |
| -50% | 355 | 1021 | 2.88 |
| -20% | 319 | 528 | 1.66 |
| -10% | 105 | 67 | 0.63 |
| -5% | 24 | 35 | 1.46 |
The above table shows the average number of trading days the market took to drop and the average number of trading days it took to recover for drawdowns bigger than -50% and between -20% and -50%, -10% and -20% and -5% and -10%. With the exception of the -10% to the -20% bracket, the ratio of recovery days to drop days is always greater than one. This means that in most cases, the market takes longer to recover to its previous highs than it takes to reach the bottom of its downturn. In other words, the market tends to go up slow and come down fast.
Timing – The Other Unknown
Although probability allows us to quantify the likelihood of a drop in the value of our portfolio, it does not tell us when such a drop is going to happen. This brings added uncertainty and hence added risk to an investment in the stock market as a sequence of significant downturns in a row can significantly effect the value of a portfolio. In particular, since major market drops take longer time to recover, a sequence of major market drops in a row can significantly delay the time it takes for the portfolio to recover in value.
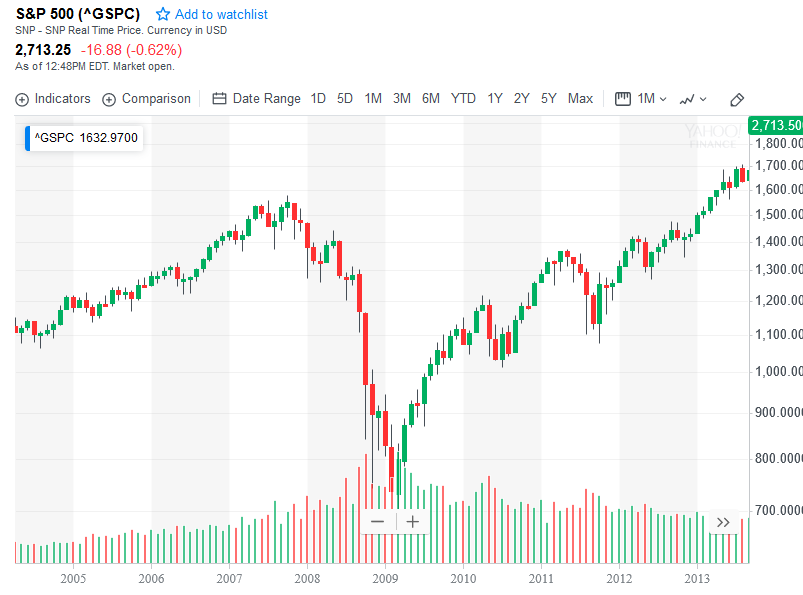
For example, as discussed in the post True Diversification , 1996 to 2013 was a particularly rough period for the stock market.
| Date | Low | High | Years | |
| 09-12-1996 | $671.15 | |||
| 03-24-2000 | $1527,46 | 3.53 | Up | |
| 10-09-2002 | $776.76 | 2.55 | Down | |
| 10-09-2007 | $1565.15 | 5.00 | Up | |
| 03-09-2009 | $676.53 | 1.42 | Down | |
| 03-14-2013 | $1563.23 | 4.02 | Up |
The above table also shows that in 2009 the market was almost at the same price as it was in 1996, $676.53 compared to $671.15. In about 1.42 years the market lost all the gains that it had gained over the past 11 years or so. This illustrates the additional risk inherent to investing in a stock fund.
Putting It All Together
The wise investor knows that there are two sides to the coin. When considering an investment the potential downside is just as important as the potential upside. Thus when considering an investment in the stock market such as that in an S&P 500 index fund, one needs to consider the maximum drawdowns as well as the average annual returns.
Combining the data we outlined in the post Saving For Retirement with the information in the above paragraphs, an investor can be confident (at around the 95% level) that for a 10 year investment they can expect a CAGR of -1.05% or greater and a maximum drawdown of at least -20%. Similarly for a 25 year investment, they can expect a CAGR of 4.05% or more and a maximum drawdown of at least -20%.
This means that one can expect better overall returns for an investment in the S&P 500 if they are willing to hold the investment for a longer period of time. That said, the longer one stays in the market, the likelihood of a major drop in value of the portfolio gets close to certainty.