The human brain has evolved to analyze past experience and chart the future course of action according to the conclusions derived from this past experience. We also have expectations based on past experience. We go to work and expect to get paid, we go out on dates and decide if the person is a good fit for us or not, we follow the traffic laws and expect to arrive at our destination safely.
Imagine for a second how your life would be like if past experience is not indicative of future behavior. What if you go to work and sometimes you get paid and other times you do not? Worse than that, what if sometimes you have money taken from you when you are at work? What if the person you married is nothing like the person you dated? What if the traffic rules and direction of traffic changed every day? Would you be able to get to your destination?
The words Past Performance is Not indicative of Future Results is not just a legal statement or a theoretical statement that never happens. This uncertainty is the reality of the investing world. Often put to the side but always present, whether at the end of a prospectus or part of a disclaimer, the words Past Performance is NOT Indicative of Future Results are in my opinion the hardest part of any investing endeavor. For if you cannot rely on past results to make decisions for the future what can you do? Is all the knowledge and wisdom of past experiences meaningless?
Investing in the S&P 500
Let’s take the case of the S&P 500 for example. As I mentioned in my post The Lost Decade, when I started investing in the stock market I was told that I can expect to make an average of 10% per year. Financial literature sometimes says this number is closer to 7%. This means that although one cannot expect to make money every year, over the long term one hopes to come out ahead.
In my post The Lost Decade I also mentioned how I had invested monies for about 10 years and did not have anything to show for it. How would have I done if instead of starting to put in monies in January of 1998 I had started in December of 1997 or March of 1996 or any other day?
To answer this question let’s have a look at what would have happened had an investor put in money in the S&P 500 and held it for a 10 year period. We will look at the results for each day between 1950 to the present as illustrated by the chart below. For the purposes of this example will will consider the case when the investor makes one single investment at the outset and holds it for 10 years. For example, on 01/04/1950 the S&P 500 closed at $16.85. Ten years later, on 01/04/1960, it closed at $59.91. Thus if an investor had gone in the market with an investment in the S&P 500 at the end of the day on 01/04/1950, ten years later on 01/04/1960, they would have had a return of 253.18%. If we repeat this calculation for every day between 1950 and 2016 we get the chart below.
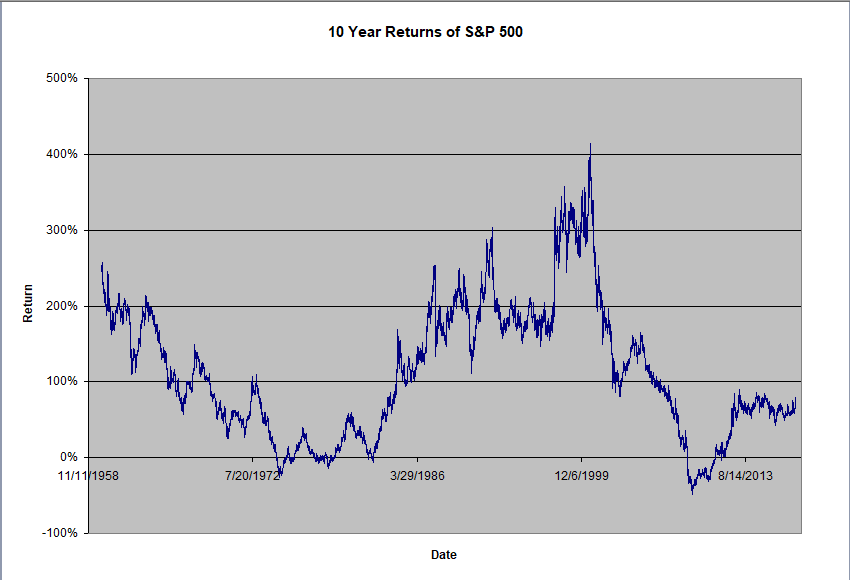
The most striking feature of the above chart is that there is a huge difference in the expected 10 year returns. This difference depends on when the investor made his investment and what the market did in the 10 years after that.

Although the average 10 year return is 111.2%, the minimum return is -48% while the maximum return is 415% where 100% return corresponds to doubling you money, -50% corresponds to loosing half of it etc… We can use the 10 year returns to compute the compound annual gross rate or CAGR which gives us an estimate of how our investment performed on a year by year basis. This can be calculated using the formula:
CAGR = [(Ending Value/Beginning Value) ^ (1/Number of Years )] -1
Computing this value for every ten year period between 1950 and 2016, as we had done previously for the 10 year returns, we get the chart below.
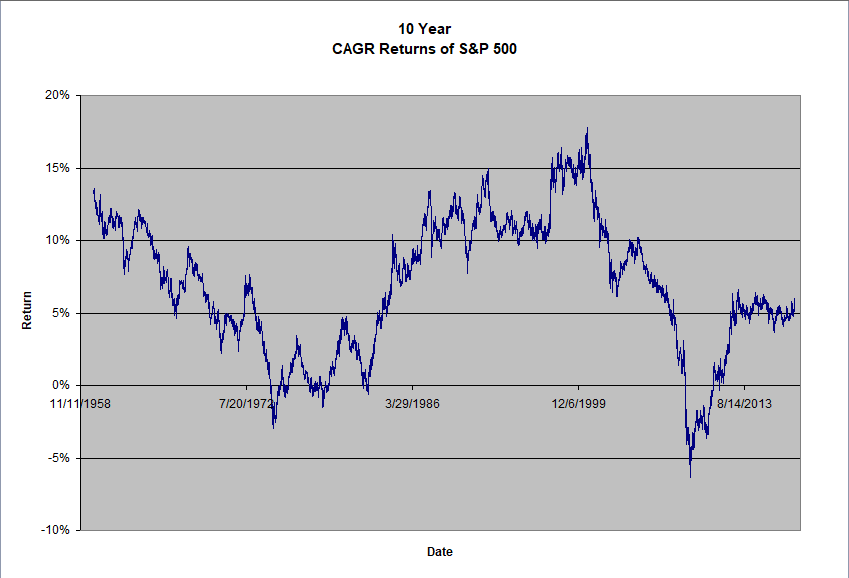
The above chart shows that for the 10 year period ending on 9/1/2000 the investor would have had a CAGR of 17.80% while for the 10 year period ending on 3/9/2009 he or she would have had a CAGR of -6.33%. The average CAGR corresponding to the average 10 year return of 111.2% is 7.76%.
Dealing With Uncertainty
The above discussion makes it very clear that the investor would be naive to expect his investment to return a CAGR of 7.76%. Although this might be true in a theoretical sense since the mean or expected value is indeed 7.76%, in the practical world, the investor could end up waiting 10 years only to loose half his money !
To properly address this uncertainty the investor needs some better tools. This is where statistics comes in. Using statistics the investor can replace the deceptively secure deterministic statement that his investment is going to yield 7.76% with a more truthful probabilistic statement that also tells the investor the odds that his investment is not going to work out as expected.
The odds of the investment not working out are computed from the histogram of investment returns as shown below. The histogram looks at how many times the return of a 10 year investment falls within a particular range and then uses this information to compute the probability that an investment will be within the desired expectations.
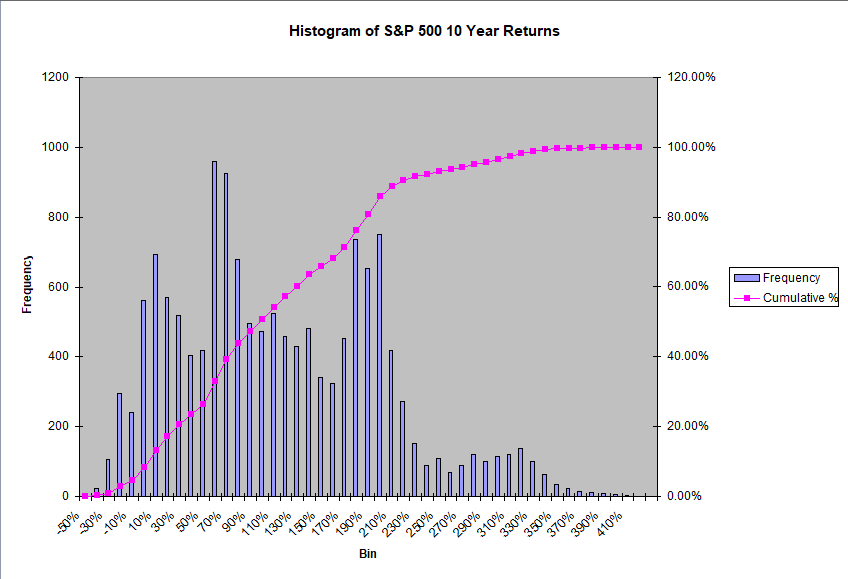
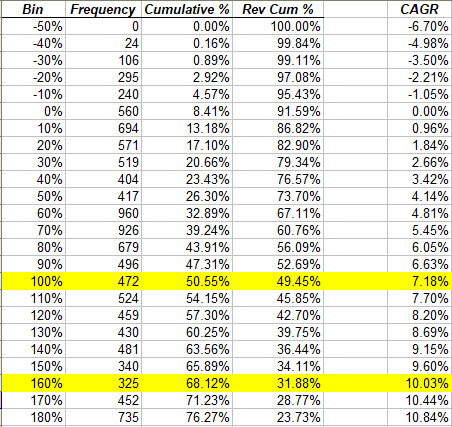
The histogram data above shows that the investor has a 49.45% chance that the CAGR of his or her 10 year investment in the S&P 500 will be 7.18% or higher. It also shows that he or she only has a 31.88% chance that the CAGR of his or her 10 year investment in the S&P 500 will be 10.03% or higher. This has very different implications to the average investor than saying they can expect a CAGR of 7.76%! These probabilities are saying that there is at least about a 50% chance that after 10 years, the investor is going to be disappointed.
In it for the long haul
Although 10 years are a considerably long time for any investor, let’s have a look at an even longer time frame. How would the investor have done had he or she chosen to stay the course and stayed in the market for another 15 years for a total of 25 years?
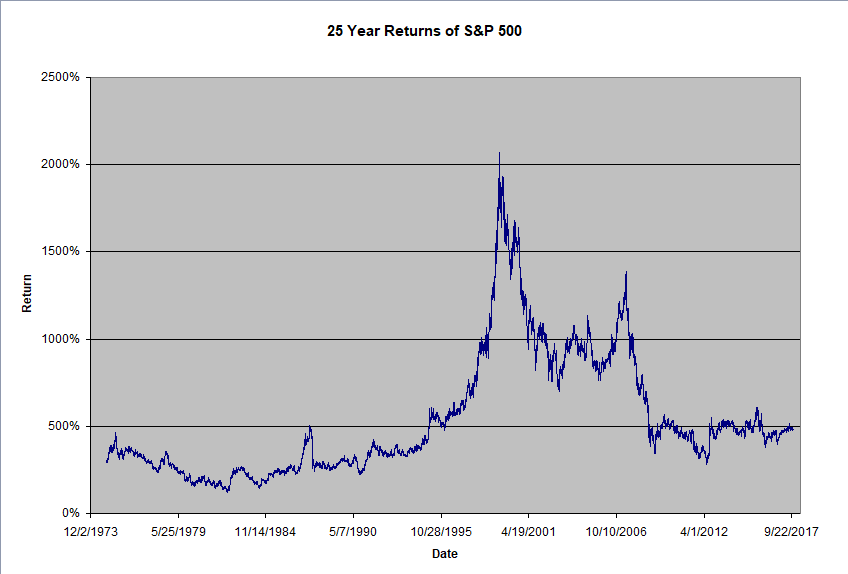
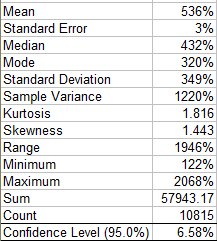
The above chart shows similar characteristics to its counterpart for the 10 year holding period. In particular it shows that although the average 25 year return was at 536%, the minimum was at 122% and the maximum at 2068% for a total difference of 1946%.
We can use the 25 years returns to compute the CAGR as shown in the chart below.
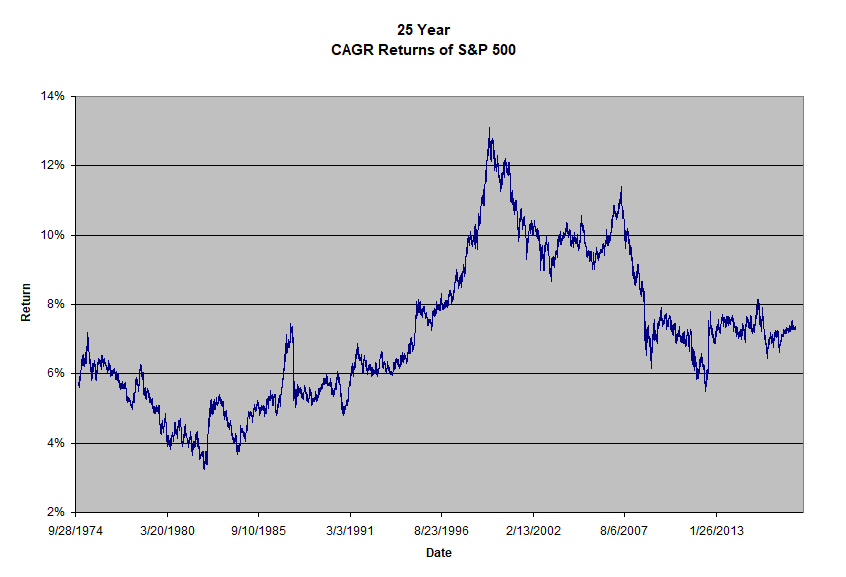
The above chart shows that for the 25 year period ending on 8/10/1982 an investor would have had a CAGR of 3.39% while for the 25 year period ending on 6/29/1999 an investor would have enjoyed a CAGR of 13.09%. The average CAGR corresponding to the average 25 year return of 536% is at 7.68%.
Using statistics to quantify the uncertainty on the 25 year returns we get the following histogram and data table:

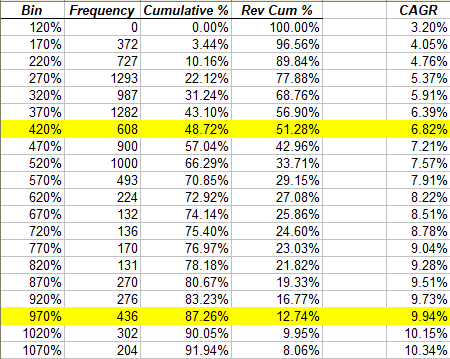
The histogram data above shows that the investor has a 51.28% chance that the CAGR of his 25 year investment in the S&P 500 will be 6.82% or higher. It also shows that he or she only has a 12.74% chance that the CAGR of a 25 year investment in the S&P 500 will be 9.94% or higher. Conversely, these probabilities are also saying that there is at least about 50% chance that after 25 years, the investor is going to be disappointed.
The Informed Investor
The above discussions clearly demonstrate that if an investor plans on funding their retirement by investing in an index fund such as the S&P 500, despite their best efforts, disciplined approach and regular contributions, there is a 50% chance that they are not going to have enough money to retire. These odds are no better than a coin flip!
The good news in all of this is that today’s investor has time on their side. They can make decisions today such that they increase the odds that 10 years or 25 years from now their investment meets their expectations.
I’ve chosen to tilt the odds in my favor by adding a diverse group of quantitative strategies to my portfolio. As discussed in the post, True Diversification I believe that true portfolio diversification comes from using different strategies based upon different assumptions. By allocating my assets to several quantitative Investment Strategies with superior Investment Returns, I feel confident that no matter what the market does in the next 25 years my portfolio will continue to grow as planned.
What are you going to do?