“The trend is your friend” is one of the catchier phrases in the trading and investing communities. It is also the underlying assumption behind a lot of people’s approach to investing. When an investor goes looking for a hot market to put some money in, whether it be a stock or otherwise, if they align themselves with the direction of the market, then they are hoping that the trend is going to continue and that they can go along for the ride.
This approach is also known as momentum investing and is the opposite of the value investing approach. Whereas in a value investing approach you are trying to buy low and sell high, in a momentum approach you are buying high and hoping to sell even higher. However, just as we did in a value investing scenario with TF Pullback strategy, we have to ask the right questions if we want to be profitable with this approach. These are: “When do I know that a trend is going on?” and once the trend is established, “How long is the trend going to last?”
This strategy takes a quantified approach to answer the above questions. The methodology is applied to the 10-Year T-Note Futures denoted by the symbol ZN. These futures are based on the treasury notes issued by the US government as described here.
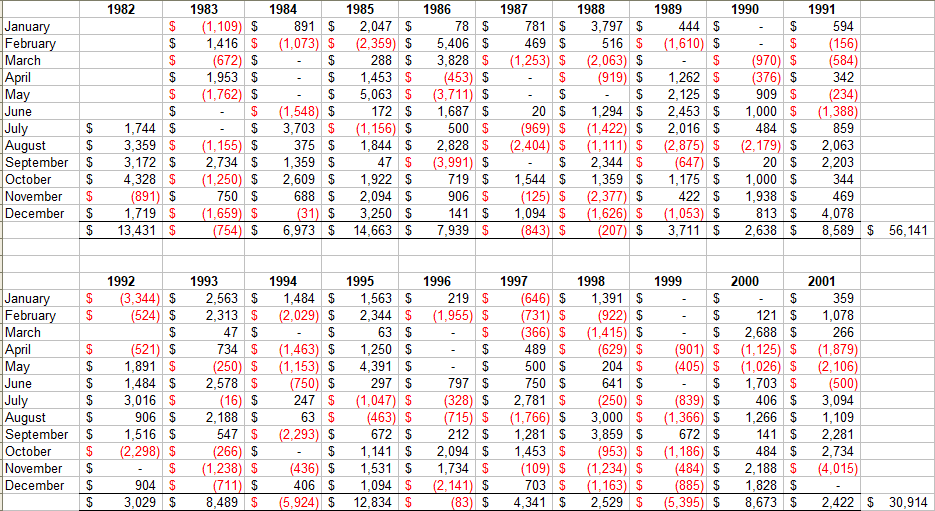
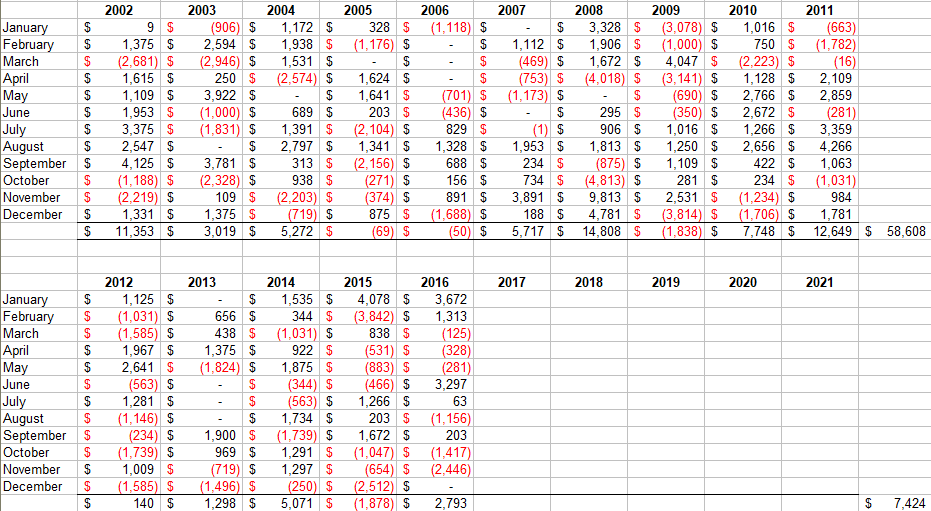
The strategy was backtested for a period of 34+ years, from 1982 to 2016, and showed an average annual return of $4,108 and a maximum drawdown of -$6,603 for a Risk Reward ratio of 0.62. These correspond to an average annual return of 51.35% and a maximum drawdown of -82.54% of allocated capital of $8,000. This strategy has around 12 trades per year with an average holding period of 20.8 days.
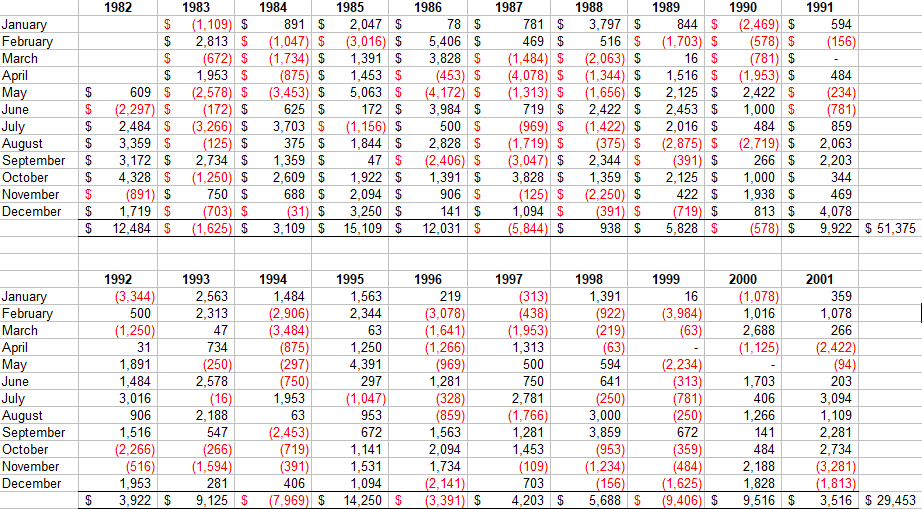
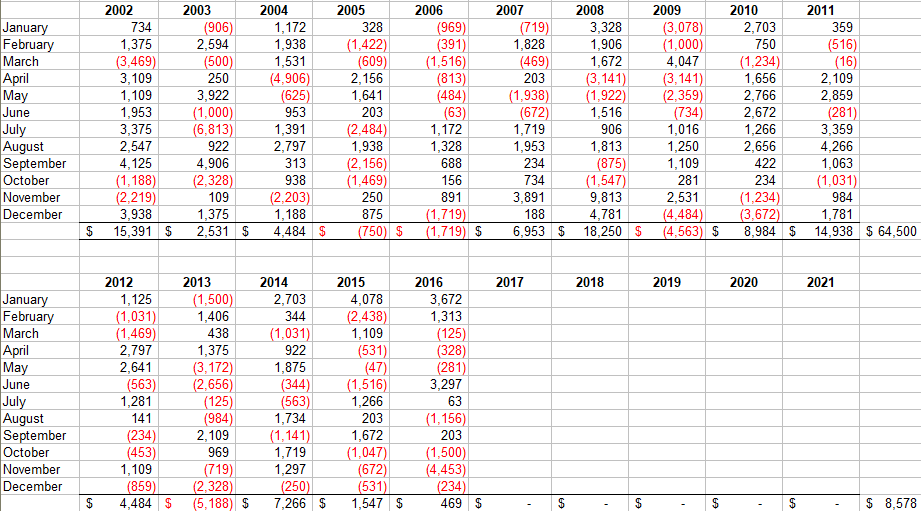
In contrast, during the same time period, the continuous back adjusted futures contract or benchmark, had an average annual return of 21.81% with a maximum drawdown of -92.93% for a risk reward ratio of 0.24.
If we use the Risk Reward factor to compare the strategy and the benchmark, the ZN long is about 2.6 times better than a buy and roll approach of the benchmark as it generates about the same returns but with much less drawdown.
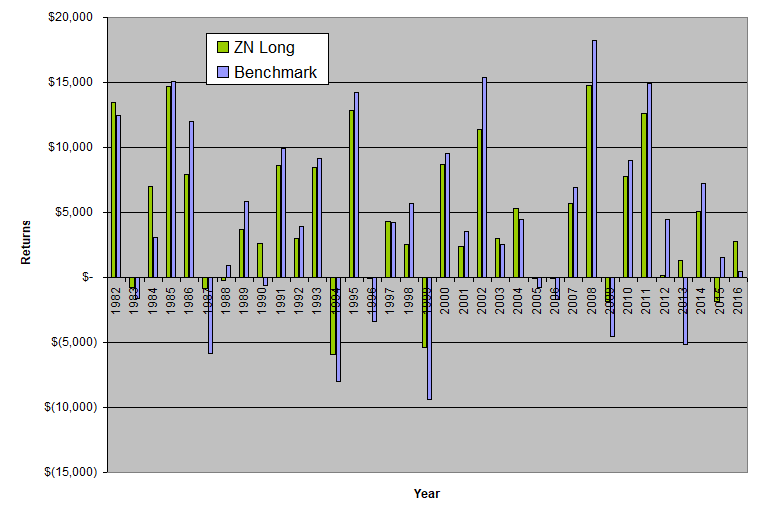
When we take a closer look at the above tables, we see that there is quite a bit of variation in the 10 year performance. For example, the benchmark did $51,375 from 1982 to 1991, then $29,453 from 1992 to 2001 and then $64,500 from 2002 to 2011. In the past five years, from 2012 to 2016, it did only $8,578 which would extrapolate to a 10 year return of only $17,156 if nothing changes. As expected, similar variations are also observed in the strategy.
As we discussed in What makes a good strategy? the astute investor knows that these variations are normal and to be expected. No market is the same for such an extended period of time and successful investing requires one to have a long term view. Although it is easy to find a strategy that shows great performance metrics over a short period of time, it is hard to find a strategy that stands the test of time. Thus with a Risk Reward Ratio of 0.52 over a 34+ year period the ZN long strategy stands out as an exceptional performer.

Please note that the above chart shows portfolio growth without re-investment. One could potentially increase the returns by re-investing some of the monies generated. For a more complete discussion including risk considerations and money management, please read our posts Investing in the Futures Markets and Compounding With Futures.