This is probably the most exciting post on this website as it shows the power of the quantitative investment approach. Although conventional investing wisdom talks a lot about the power of compounding over time, they fail to discuss the effect that boosting your investment returns have on compounding. The power of compounding is even more impressive when combined with strong investment returns.
The Two Sides Of Compounding
Compounding is an inherent characteristic of a buy and hold investment in a stock fund. If you buy shares in a fund and hold on to them for a period of time, you are automatically compounding your daily returns.
For example, if you buy 10 shares at $100 each, and over the next three days the market goes up by 5%, down by 1% and then up by 10% you end up with $1,143.45 which is a return of 14.35% on your original investment of $1000. This is slightly higher than the 14% return you would have generated if you invested $1000 each day. This small difference becomes much larger and more significant as time goes buy.
It is almost never talked about but compounding also works the other way. In particular, through compounding, the buy and hold approach can protect you when the market crashes. Say for example that the market goes down 50% two days in a row. On the first day your $1,000 investment is worth $500. On the second day your investment falls another 50% down to $250. So although the market has fallen a total of 100%, your investment has only incurred a 75% loss.
Compounding With Futures Contracts
In the post Investing In The Futures Markets we explored some of the differences between stocks and futures and discussed the role that leverage plays in managing our monies when investing in the futures markets. We then took it a step further in the post How Risky Are Futures? where we quantified the risks involved and looked at capital allocation for different confidence levels.
Compounding with futures contracts is possible provided one follows the guidelines described in the previous posts. Unlike a buy and hold investment in a stock fund, compounding is not done with every trade. One must wait until the capital in the account is sufficient to cover the margin requirement for additional contracts as well as the bigger drawdowns that could be experienced with more contracts.
As an example let’s have a look at compounding the returns for the Quantopolis Investment Strategies. In the post How Risky Are Futures? we saw that the capital requirements for the different confidence levels were as follows:
| Strategy | 95% | 99% |
| TF Pullback | $13,500 | $19,000 |
| VX Short | $16,000 | $19,500 |
| ZN Long | $4,500 | $6,000 |
| ES Pullback | $11,500 | $14,500 |
| NQ Pullback I | $24,000 | $35,000 |
| NQ Pullback II | $22,000 | $31,000 |
| Portfolio I | $20,000 | $22,000 |
| Portfolio II | $41,000 | $46,000 |
Thus, following the guidelines outlined in Investing In The Futures Markets an investor following the 95% confidence level could purchase N contracts whenever the capital in the account is more than N times the 95% confidence level capital allocation for the strategy being traded. So for example at $13,500 they would buy one contract, at 2*$13,500=$27,000 they would buy two contracts etc…. Similarly for the 99% confidence level, the investor would use N*$19,000 to determine the capital requirement needed to trade N contracts.
The investor would keep on buying N contracts until the next capital level is reached. In this manner, the number of contracts purchased stays the same after a loss. This is similar to the compounding with stocks approach as described above. That said, the investor needs to have enough cash to keep covering the margin requirements for N contracts. That’s why the amount of capital allocation per contract is so important. Should the investor have less capital than required for N contracts, then they would need to reduce the number of contracts traded.
Using this approach the CAGR for the Quantopolis Investment Strategies is as follows:
| Strategy | 95% | 99% |
| TF Pullback | 29.99% | 20.83% |
| VX Short | 38.33% | 31.43% |
| ZN Long | 26.97% | 25.34% |
| ES Pullback | 33.97% | 31.01% |
| NQ Pullback I | 25.75% | 17.32% |
| NQ Pullback II | 48.40% | 32.66% |
| Portfolio I | 58.25% | 55.96% |
| Portfolio II | 55.62% | 46.89% |
As expected the CAGR for the 99% confidence level is smaller than that for the 95% confidence level. This is because the 99% confidence level has higher capital requirements than the 95% confidence level. As such the investor has to wait until they have more money in their account before being able to buy more contracts.
Note that the CAGR numbers given above are different than the average annual returns given on the Investment Strategies page. There are a couple of reasons for this. First off, the CAGR is a different measure than the simple average annual return. Second, the simple average return used different capital allocation requirements than the CAGR numbers above. Both performance measures are valid in their own right and useful to the investor.
Before we have a look at what these CAGR numbers mean for the Quantopolis Investment Strategies it is worth noting that there are other approaches for compounding with futures. One such method is the Fixed Fractional Method outlined in the book Portfolio Management Formulas by Ralph Vince. With this approach, the number of contracts traded goes up and down as the capital goes up and down. Although this approach has the potential for even bigger returns, it also produces bigger drawdowns and thus might not be suitable for many an investor.
The True Power Of A Quantitative Approach
The performance measures for the Quantopolis Strategies given on the Investment Strategies page did not include the effects of compounding. The true power of these strategies becomes apparent when one does in fact compound the returns as outlined above. For example, with a little bit of luck, as illustrated below for the ZN Long strategy, an investor can turn a $5,000 investment into more than $1,000,000 in about ten years. I do say a little bit of luck here because the strategy has to perform and 95% confidence or 99% confidence are still not 100% confidence. That said, turning $5,000 into $1,000,000 using a investment related to the US 10-Year T- Notes is remarkable indeed.
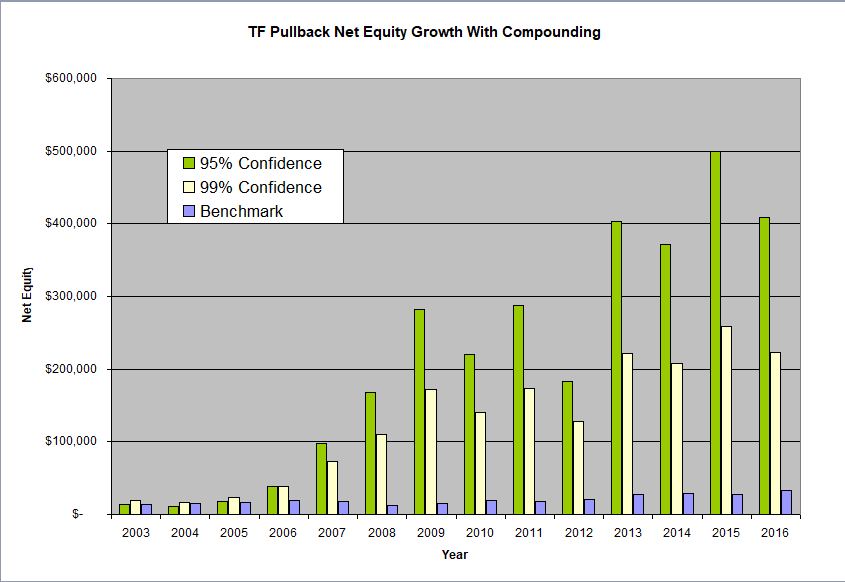
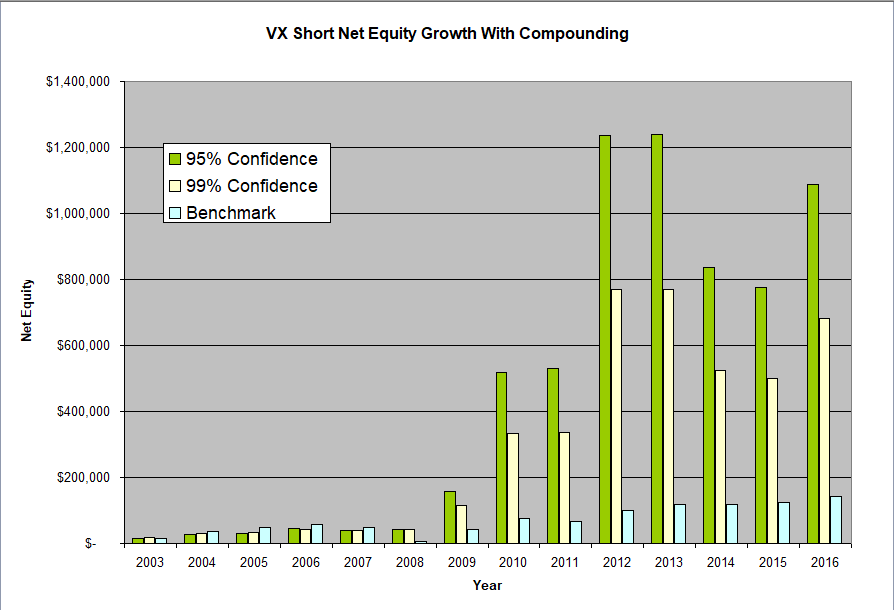
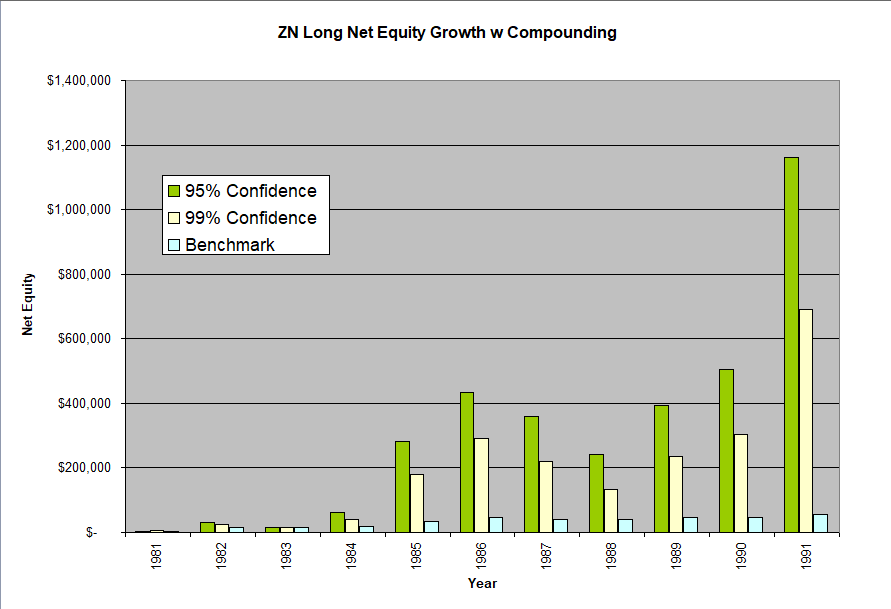
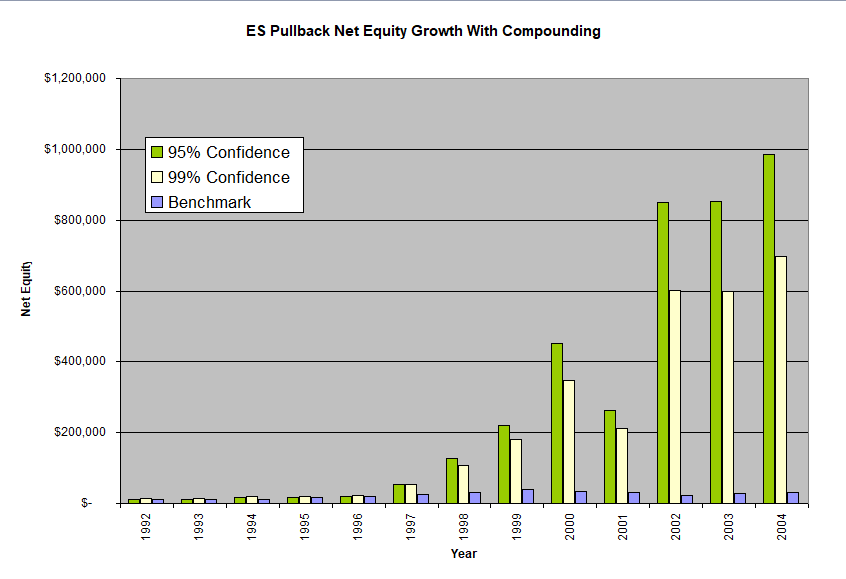
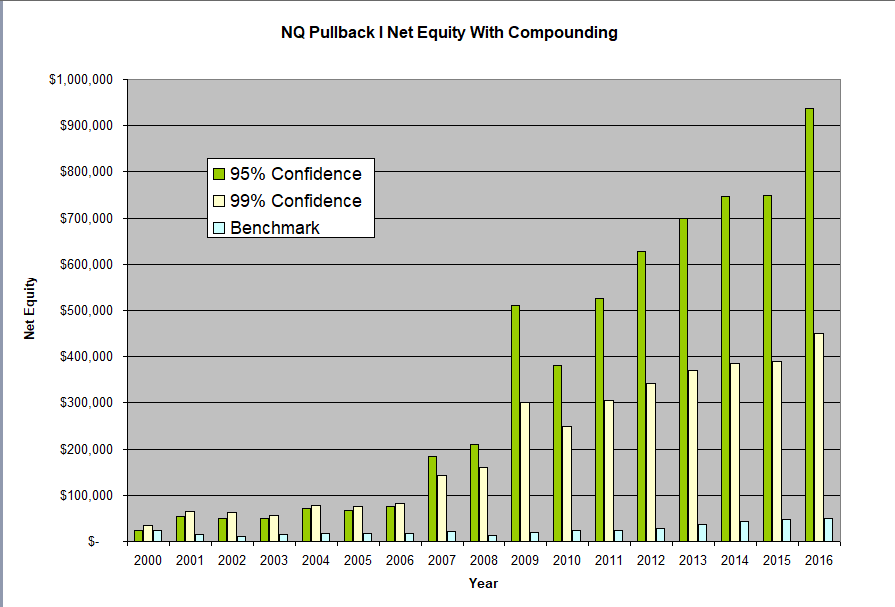
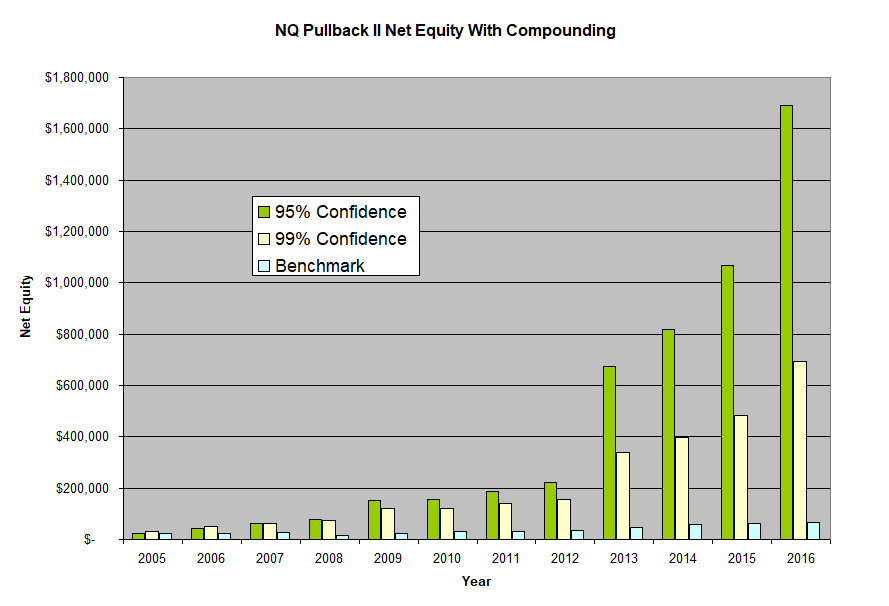
As the above charts clearly show, the road to success is not always upwards. There can be a year or two where the strategy looses money and the portfolio capital goes down. This is when the investor’s belief and commitment in the strategy being deployed will be tested. Astute investors know that they need to research the strategy well in advance before putting any monies in it. Thus once in they can take a hands off, set it and forget it type approach.
Note that although in theory an investor can keep adding more and more contracts as their capital grows, practical considerations make this an untenable proposition. This is because all these strategies are active strategies as opposed to a sit and hold type strategy. This means that they rely on a quick entry and exit in the market. Thus the amount of contracts being purchased at once becomes relevant when the number gets big compared to the daily volume of contracts traded. This liquidity limitation can have an adverse reaction on the slippage and thus on the performance of the strategy.
Thus for the ZN Long and ES Pullback strategies, only the first 10 years of performance are shown. As one is starting out, the number of contracts is small and thus it is reasonable to expect that liquidity is not going to be an issue. The same expectation can be had for the other strategies which have a relatively shorter history and thus the number of contracts traded is still reasonable. It is worth mentioning here that this is one of the main reasons why I only offer my strategies through Striker. Striker is structured on a per contract basis and as such I am able to control the number of contracts traded in my strategies. This means that I can and will close the strategies to new investment before there are liquidity issues.
Compounding And Diversification
The compounding approach can also be applied to the Quantopolis Portfolios. The Quantopolis Portfolios combine different strategies with different approaches into one account thereby obtaining a better risk reward ratio than each strategy on its own. This results in a better CAGR and thus significantly better returns when the effects of compounding are taken into account. In addition true diversification reduces the volatility of the portfolio such that is some cases, as for example in the charts below, the equity curve is continuously upwards. Since in the portfolio approach the capital is spread among several strategies one can buy more contracts and invest more capital without running into liquidity issues.

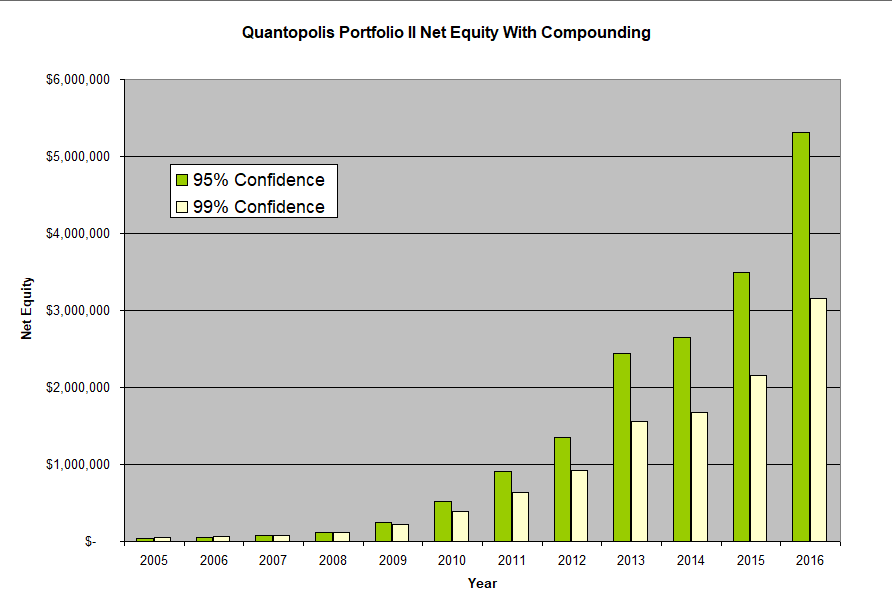
The above charts illustrate the non-linear nature of compounding. In practical terms this means that although the portfolio does not seem to be growing much in the first few years, over time the effects of compounding stack up on top of each other and capital ramps up. Thus the investor must be very patient and let time do its thing as the strategies and compounding work together to build capital.
In conclusion, as the above charts show, although there are indeed risks in trading futures, the potential rewards are outstanding. In 13 years, the Portfolio I turned $20,000 into more than $7,000,000 while in 11 years, the Portfolio II turned $41,000 into more than $5,000,000. Thus in my opinion the astute investor should give serious consideration to assessing whether such an investment is suitable for their portfolio.
Hi Michael
I’ve tried your Contact Me form. I cannot send you an email. What am I doing wrong. I’ve tried on three different platforms. I would really like to discuss a project with you
hi there, thank you for reaching out and for your persistence. i am sorry the contact form was giving you trouble. i just checked it and i cannot find any issues.
you can send me an email directly to info at quantopolis dot com