You’ve probably heard it many times : ” Buy low, sell high.” This beckons the question : ” How low is low and how high is high?” Every day the financial news media is full of people giving their opinion on whether the market is going higher or lower. It is not uncommon to find different people with different views on the same day. Can you guess who’s right?
This strategy takes the guesswork out of the picture by taking a quantified approach to finding an answer to the question: “How low is low and how high is high?”. The system takes advantage of short term swings in the market, going in when it deems the market to be at a short term “low” and exiting when it thinks the market has reached a short term “high”.
The Russell 2000® Index or RUT is the recognized benchmark measuring the performance of the small-cap segment of the U.S. equity universe. Thus this strategy effectively identifies short-term value investment opportunities in the small-cap segment of the US equity market.
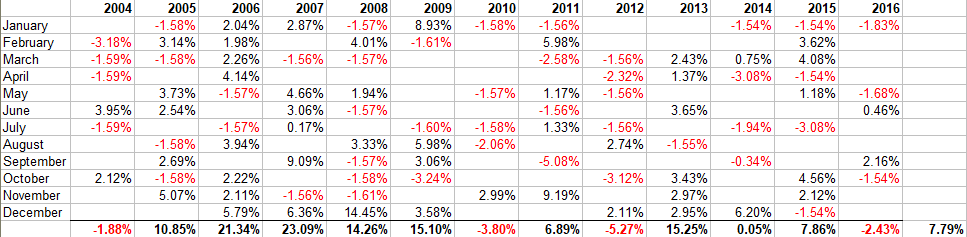
The strategy was backtested for a period of 13 years, from 2004 to 2016, and showed an average annual return of 7.79% with a maximum drawdown of -7.39% for a Risk Reward ratio of 1.05. The strategy has around 9.2 trades per year with an average hold of 3.64 days. For the months it had an open position, it showed a success rate of 52.58%.
Over the backtesting period the strategy had three losing years. This is not a surprise because with an average of only 9.2 trades per year, 12 months is a relatively small sample size and is thus more likely to show extreme values. That said, the strategy has a very good Risk Reward ratio overall. In addition it is well adapted to different market conditions posting positive returns in 2008 as well as 2009 and 2013.
In contrast during the same time period, the underlying index and benchmark, the RUT, had an average annual return of 8.75% and a maximum drawdown of -59.89% for a Risk Reward ratio of 0.15. Over the backtesting period, the RUT had 4 loosing years and a success ratio of 60.61% up months.

Thus, if we use the Risk Reward factor to compare the two strategies the TF Pull Back strategy is about 7 times better than the buy and hold approach as it generates comparable returns with significantly less drawdown. The high Risk Reward ratio of the strategy allows us to boost our returns using futures contracts.
The Russell 2000® Index Mini Futures denoted by the symbol RTY track the performance of the Russell 2000 Index. Trading this strategy with the RTY futures gives us an annual average net return of 63.16% and a maximum drawdown of -59.92%. The Risk Reward ratio remains constant at 1.05.
Using today’s RTY futures value of 1,500.00, multiplier of 50 and a margin of $3,500, this translates to a minimum capital requirement of $9,250 and an average annual return of $5,843. This also equates to a dollar return of $10,695 in 2008 which is equivalent to a 115% return on the allocated capital of $9,250.
The chart below shows hypothetical equity curves for a $10,000 investment in the TF Pullback strategy compared with that for an equivalent investment in the RUT over the backtesting period.
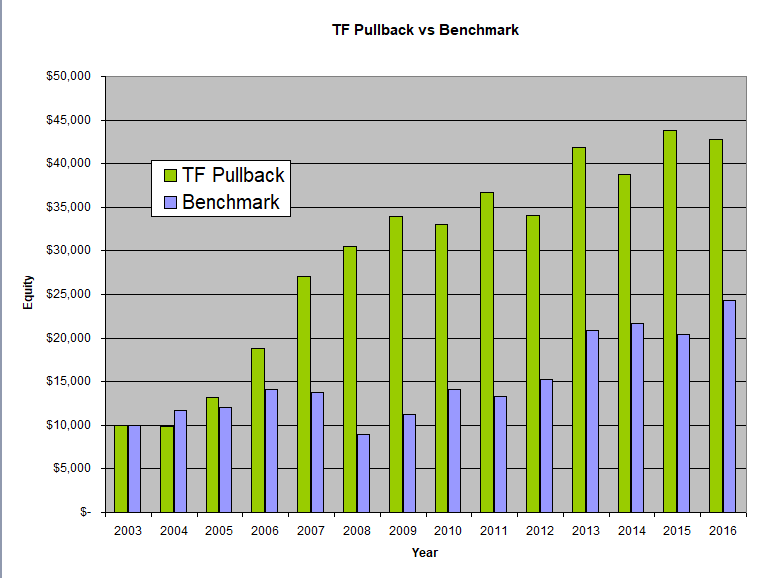
It is worth noting that in the above discussion, the monies generated from the TF Pull Back strategy were not re-invested in the system. On the other hand, by its nature, a buy and hold approach automatically re-invests any monies that are generated.
Thus one could potentially increase the returns of the TF Pull Back system by re-investing some of the monies generated. That said, investing in the Futures Markets requires different considerations than investing in a stock or an ETF. For a more complete discussion between the two approaches, including risk considerations and money management, please read our posts Investing in the Futures Markets and Compounding With Futures.