One of the tenets of conventional investing wisdom is Dollar Cost Averaging (DCA). This means buying a fixed dollar amount of the underlying security on a regular basis as discussed on Modest Money. The premise behind dollar cost averaging is that it can help you increase your returns as you are buying more shares when the market is cheap and less shares when the market is more expensive. It also has the additional benefit that you do not get caught up in trying to time the market. By buying in (or selling out of) the market on a regular basis you are ignoring market fluctuations and making your decisions independently.
In the post Past Performance Is Not Indicative of Future Results we looked at what would have happened had we made a single investment in the S&P 500 and held it for a 10 year or a 25 year period. What would have happened if instead of making one single investment at the outset we would have made weekly contributions over a 10 year or a 25 year period in line with the dollar cost averaging approach ?
Regular Contributions
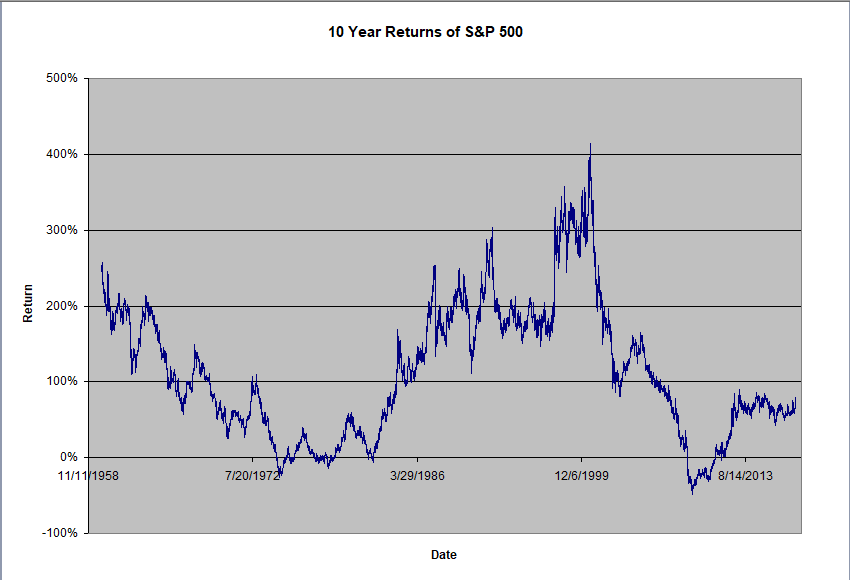
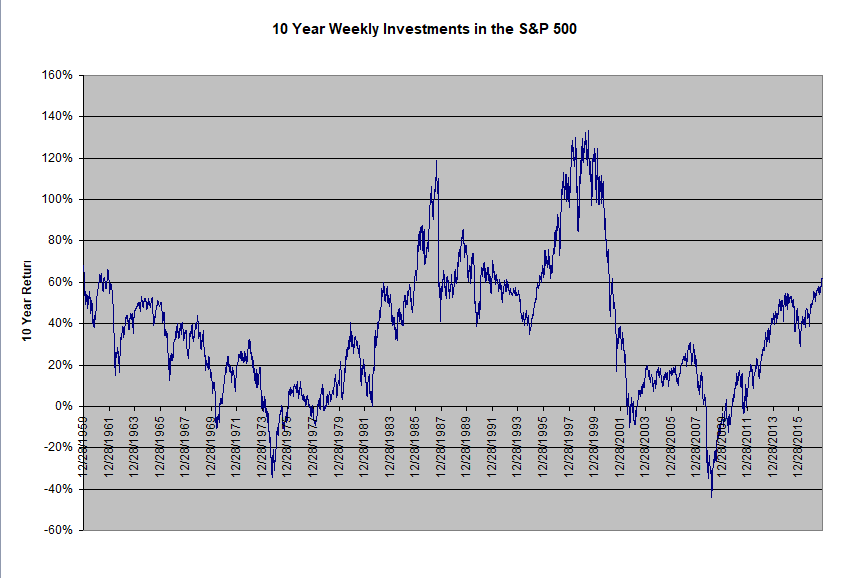
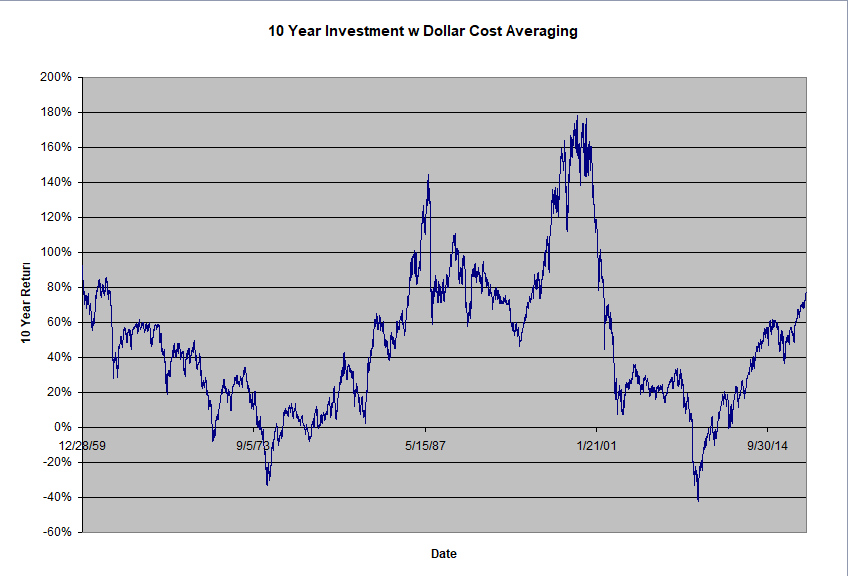
The figures below compare the 10 Year Returns using three different approaches. The first approach is that utilized in the previous post and involves making a single investment at the outset. The second approach involves buying one share of the market every week. The third approach involves buying a fixed dollar amount of the market every week and is the same as the dollar cost averaging approach.
Note that over our period of study, from 1950 to 2017, the market went from $16.66 per share to $2575.26. Thus if you bought one share of the S&P 500 in 1950 it would have cost you $16.66 but to buy one share in 2017 it costs $2575.26. Similarly if you invested say $100 per week during this time, you would have bought 6 shares in 1950 but only 0.0388 of a share in 2017. Thus for the purpose of this study we will assume that one can buy a fraction of a share and that the value of money over time has not changed.
The figures below shows that the charts for the 10 Year Returns look very similar to that when we did a single investment at the outset. Whether we buy one share a week or we use Dollar Cost Averaging we can not eliminate the uncertainty in our returns. In addition the overall returns are significantly lower than when we invested all of our money at the outset. This is because when we invested all the money at the outset, it had more time to grow than when we invested it little by little.


The differences between these three scenarios is quantified in the following table:
| Single | Weekly | DCA | |
| Mean | 111.20% | 37.46% | 48.63% |
| Standard Error | 0.72% | 0.58% | 0.74% |
| Median | 98.87% | 36.66% | 45.33% |
| Standard Deviation | 87% | 32% | 40% |
| Sample Variance | 76% | 10% | 16% |
| Kurtosis | -0.28 | 0.26 | 0.59 |
| Skewness | 0.53 | 0.54 | 0.78 |
| Range | 463% | 177% | 221% |
| Minimum | -48% | -44% | -42% |
| Maximum | 415% | 133% | 179% |
| Sum | 16,197 | 1,131 | 1,468 |
| Count | 14,565 | 3,019 | 3,019 |
| Confidence Level (95.0%) | 1.42% | 1.14% | 1.44% |
The above table shows that the DCA approach does indeed do better than buying one share a week in terms of average returns, 48.63% compared to 37.46% On the other hand, the weekly investment approach has a better variance of 10% compared to 16% for the DCA.
If we compare the single investment approach to the DCA, we see that the mean return for the single investment approach is 111.20% compared to 48.63%. On the other hand the variance for the single investment approach is 76% compared to 16% for the DCA.
Returns and Volatility
Thus although dollar cost averaging does bring down the volatility of the returns, it does so at the expense of these same returns making it a less desirable solution. In light of this, if one does not have monies on hand and is acquiring monies over time, then a dollar cost averaging approach is appealing. On the other hand, if one has a sum of money readily available for investing, one has to decide if they want to significantly sacrifice potential returns in the interest of less volatility.