There is a widely held perception that investing in the futures markets is risky. In particular, the possibility that you can lose more than your invested capital is a big put-off for many potential investors. Although, this possibility is indeed true, it does not need to be the end of the line. As Nobel Prize winner Daniel Kahneman aptly discusses in his book, Thinking Fast and Slow, such hesitation is the overshooting of System 1 that combined with its aversion to unfamiliarity sometimes prevents us from seeking opportunities that can be rewarding in the long run. Let’s then engage our System 2 and have a more detailed look at an investment in the futures markets.
Types Of Risk
The best way to tackle a big challenge is to break it down into smaller parts. Let’s thus first have a look at the different types of risks involved with an investment in the futures markets.
Futures contracts are a derivative product which means that they derive their value or price from the performance of an underlying entity. For example, the ES E-Mini Futures are related to the performance of the S&P 500 index. By definition the ES contract unit is set at $50 * S&P 500 index.
The first implication of this definition is that since the ES futures are directly related to the S&P 500 their inherent risk is the same as the S&P 500. In this sense ES futures are no more risky than the S&P 500. This means that they are significantly less riskier than say Bitcoin Futures or individual stock futures. Whereas individual stock values can and have gone to zero if the company they represent goes bankrupt, in my opinion, the world economy would have to be annihilated for the whole S&P 500 to go to zero.
The second implication of the ES definition is that there is a multiplier, in this case $50 * S&P 500 index. This means that for every 0.25 point the S&P 500 moves, the ES futures is going to go up or down by $12.50. As discussed in the post Investing In The Futures Markets leverage makes everything bigger and one must be prepared to handle any potential downside to be able to stay in the market. This brings us to the first type of risk we need to address which we will call Market Risk.
Quantifying Market Risk
Since leverage makes everything bigger we need to look at what would happen if the market had a big move against our position. In particular we need to look at the extreme case scenarios or the black swan events as they are called. Such events are major and come as a surprise thus eliciting significant market moves which can happen very fast.
Under normal circumstances the markets are ahead of the curve, incorporating news and uncertainty in their prices on a daily basis. For example, if economic data indicates a recession is looming stock prices start falling way before the pain hits main street. In other circumstances however, events happen that are unexpected and thus take markets by surprise. Such was the case in 9/11 for example or the attack on Pearl Harbor in 1941.
When studying the effects these events have on the stock market one must take into consideration two different scenarios. These include the case when the event happens during market hours and the case where the event happens while the markets are closed.
In the case where the adverse event happens during market hours it can be dealt simply with a stop loss. A stop loss order is an order to close the open position if the market moves past a pre-defined level. Although when the market is moving very fast in one direction the settling price might be somewhat worse than the pre-defined level, for highly liquid markets such as the ES futures, the stop loss is an effective way of limiting losses in a position.
Dealing With Overnight Moves
The second case that needs to be considered is when the adverse event happens when the markets are closed. In this case stop losses are not of much use since the market can open at a price beyond the stop loss.
Although nowadays most futures markets are open almost 24/7, the main markets such as the S&P 500 are only open from 9:30am to 4:00pm EST Monday to Friday. What happens then if an event happens before the market opens? This was the case in 9/11 for example. To prevent a stock market meltdown, the NYSE and the NASDAQ remained closed on that day and did not open again until the following week. This was the longest shutdown since 1933.
On September 10th, 2011 the ES September futures closed at 1095.70 and when the market opened on September 17th they were at 1035.75 which is a drop of 59.95 or $2997.50. This is equivalent to a drop of -5.47%. The most striking feature about this is that although bigger than most stop losses, this drop is not as big as an active catastrophic imagination would have conceived.
Market closures and trade halts are effective in preventing panic moves by irrational investors. As such they are now widely employed by many exchanges around the world. For instance the CME operates price limits that are tied to the performance of the S&P 500 both during and after market hours as described here.
Quantifying The Improbable
Although stop losses and trade halts are effective at reducing risk, there is still the small chance that a black swan event could occur that would harm our portfolio. Once again we can harness the power of statistics to quantify the likelihood of this event and then make an informed decision about the best course of action.
A good place to start is by having a look at the daily data for the ES futures going back to 1997. This can be summarized in the following two tables which show the day moves and the night moves respectively. The day move is the difference between the close and the open of the day and the night move is the difference between the open of the day and the close of the previous day.
| Night Moves | Day Moves | |
| Mean | -0.01% | 0.03% |
| Standard Deviation | 0.19% | 1.36% |
| Range | 8.53% | 28.64% |
| Minimum | -5.47% | -12.55% |
| Maximum | 2.68% | 16.09% |
As the above table makes clear, most major moves tend to happen during the day when the market is open. This means that they can be dealt with effectively using a stop loss. The notable exception was the 9/11 attack which had the market closed for an extended period of time.
To get an estimate of how likely such an event is, let’s have a look at the Dow Jones Industrial Average data going all the way back to 1896. This included two world wars, several other wars, the great depression and the great recession, several bubbles and all the other misfortunes of more than a century. For this study we only have daily close data available so we will be looking at the close to close data, which includes both the day move as well as the night move. The results can be summarized as follows:
| Daily Moves | |
| Mean | 0.03% |
| Standard Deviation | 1.09% |
| Range | 38.36% |
| Minimum | -23.52% |
| Maximum | 15.34% |
As the above table makes clear, there can indeed be some wide ranging days in both directions. Let’s now have a look at how probable these are. To do so we compute the histogram for our data. This gives us the probability of occurrence for each event.
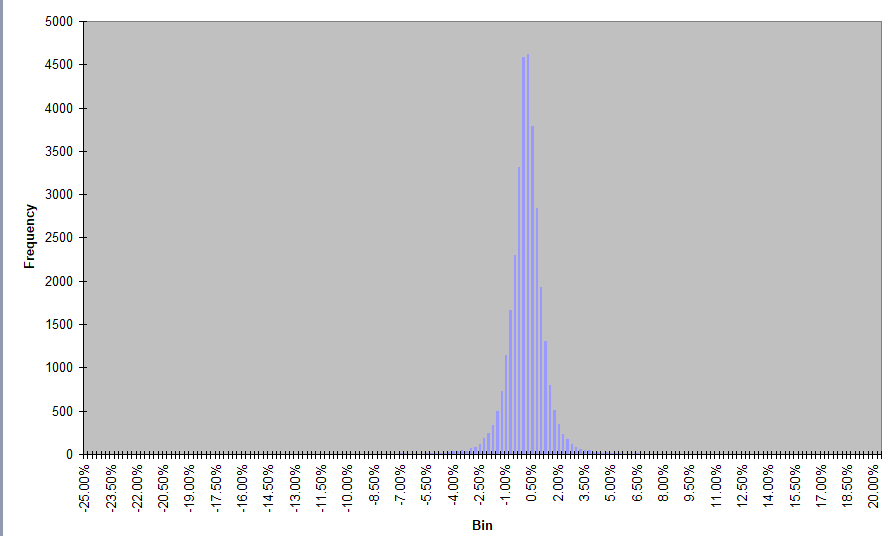
As the above histogram shows, the most common move in a day for the DJIA is between 0% and 0.25%. The probability of DJIA dropping more than -5% in one day is only 0.23% and the probability that it will drop more than -3.25% in one day is 0.87%. In other words, we can say with more than 99% confidence that the DJIA is not going to drop more than -3.25%. Similarly from the histogram we get that the probability of the DJIA moving up more than 3.25% is only 0.76%. Thus we can also say with 99% confidence that the DJIA will not go up by more than 3.25% in one day.
Quantifying System Risk
Now that we have made probable the improbable it is time to turn our attention to another type of risk. Although beyond our sphere of influence we have no control over what happens in the world and how the financial markets reacts, we do have control over what investment strategies we choose to deploy. Understanding the risks involved with each strategy is just as important as knowing what the potential rewards could be. We will thus have a more detailed look at this in the next post, Quantifying Trading System Risk.