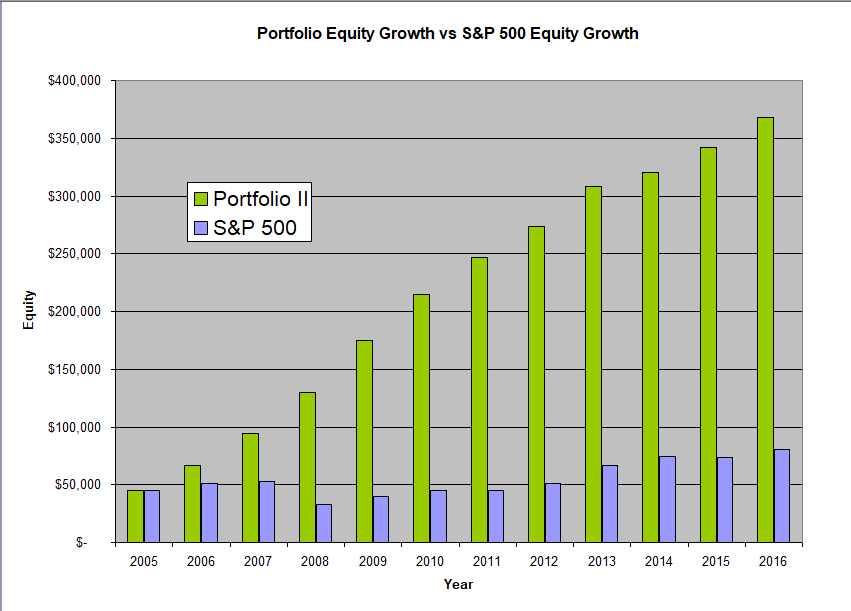
The Quantopolis Portfolio II investment strategy combines the TF Pullback, VX Short, NQ Pullback I, NQ Pullback II, ZN LONG and ES Pullback strategies into one account. The amount of capital allocated to each strategy is as described in the summary description for each strategy and totals to $76,675.
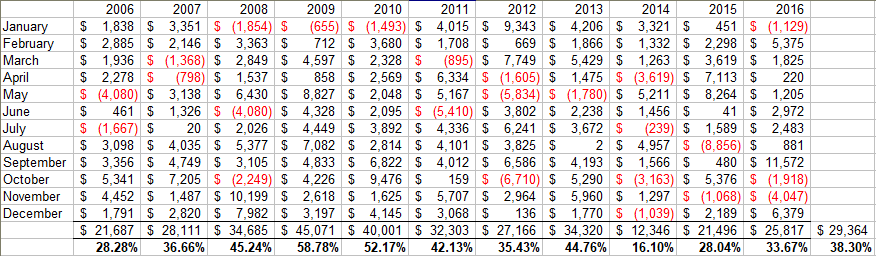
Backtesting was done from 2006 to 2016 as this is the period where data was available for all the strategies. During this period the Portfolio had a net average annual return of 38.30% with a maximum drawdown of -16.61% of allocated capital of $76,675. This translates to a Risk Reward ratio of 2.31. The portfolio averaged 75 trades per year. In addition, as the table below illustrates, during this 11 year period the portfolio had 82% up months and no down years.
The high Risk Reward ratio of 2.31 shows the power of true diversification. Different strategies behave differently in different markets thereby reducing the potential downside and increasing the overall gains. Note that although four out of the six strategies are value based strategies on the stock indices, each of them uses independent entry and exit parameters. Thus, in most cases each strategy enters and exits the market at a different time thereby applying a staggered approach to capital deployment. This staggered approach is important since stock indices are generally correlated. Hence if one was to enter and exit at the same time there would not be much diversification when the markets rise and fall together.
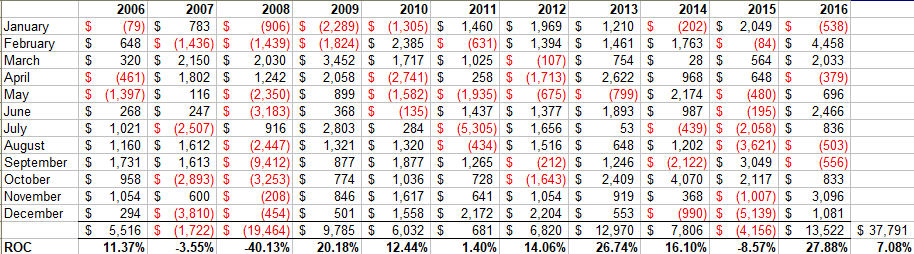
In contrast, during the same period, using a buy and hold strategy on the S&P 500 index as the benchmark, we get an average annual return of 7.08% with a maximum drawdown of -50.82% for a risk reward ratio of 0.14. During this 11 year period the S&P 500 had 64% up months and three down years.
Thus, if we use the Risk Reward factor to compare the portfolio performance with a buy and hold approach in the S&P 500, we can see that the Portfolio did about 16.5 times better.
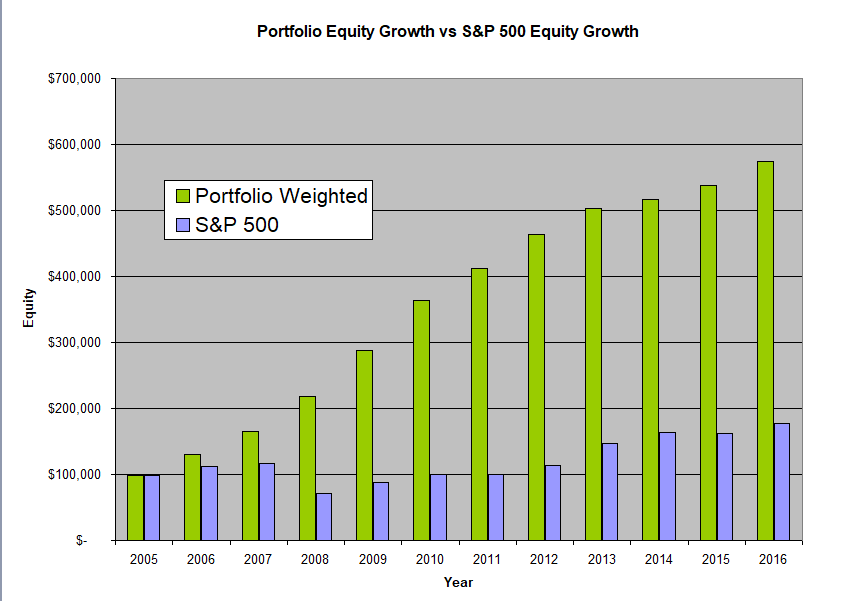
The above Portfolio assumes the investor is trading one contract in each of the six different strategies. However, an investor can customize their portfolio as they want and give more weighting to one strategy or another. For example, an investor could trade one contract in each of the value strategies and two contracts in each of the momentum based strategies. This would offer more diversification and better performance of 43.52% per year compared to 39.32% per year for the Quantopolis Portfolio II. The weighted portfolio had a maximum drawdown of -16.54% for a Risk Reward ratio of 2.63.
It is worth noting that in the above discussion, the monies generated from the Portfolio II strategies were not re-invested in the system. On the other hand, by its nature, a buy and hold approach automatically re-invests any monies that are generated.
Thus one could potentially increase the returns of the Portfolio II by re-investing some of the monies generated. That said, investing in the Futures Markets requires different considerations than investing in a stock or an ETF. For a more complete discussion between the two approaches, including risk considerations and money management, please read our posts Investing in the Futures Markets and Compounding With Futures.