The conventional and by far the most common investing approach is buy and hold. Investors buy stocks, bonds, ETFs or a combination thereof and then hold them for a long period of time with the belief that their face value is going to appreciate over time. Some investments also pay income in the form of dividends along the way. Thus the total investment return is the sum of the appreciation of the investment with time and the income it generates along the way.
Like any other approach, the buy and hold approach relies on an underlying assumption for it to meet the investor’s expectations. For the buy and hold case this assumption is that the market prices in general, and the stock or bond prices in particular, are going to go up over time. Behind this assumption are the underlying fundamental factors that drive prices upwards. These factors include economic growth, company performance and interest rates among others.
But what happens when the underlying fundamentals fail to meet expectations ? If the economy shrinks or a company does poorly then the stock prices will go down and the investor loses money. Furthermore, if the prices go down significantly, then dividends may be cut and any income already received in dividends is negated by the loss in face value of the security. Thus the investment returns are adversely effected making it more difficult for the investment to meet the set objectives.
As discussed in a previous post, Investment Returns along with risk management are the two critical aspects of any investment. The bigger the investment returns, the faster can the investment reach the objectives set out by the investor. The bigger the investment returns, the bigger the monies available to the investor. Thus the savvy investor needs to position their portfolio such that they can maximize the return on their investment as much as possible. This has to be done without taking on significant amount of additional risk, or better still, if possible, while reducing risk.
Since the buy and hold strategy loses money when the markets go down, a natural improvement would be to find a strategy that does not lose money when the markets goes down. In essence we would like to find a strategy that makes money both when the market goes up as well as when it goes down. This theoretical concept is behind the Index Momentum Strategy from Quantopolis.
The Index Momentum Strategy goes long the index when the market conditions look favourable for the market prices to go up and it goes short the index when the market conditions look adverse and likely to cause prices to go down. Thus the strategy is able to make money both as prices go up as well as when prices go down thereby increasing the overall returns for the investor.
The strategy has been backtested over a 22 year period, from 1998 to 2019, using the S&P 500 index. Over this period the strategy showed an average annual return of 6.41% with a maximum drawdown of -27.32% for a Risk Reward Ratio of 0.235. The strategy has around 3 trades per year with an average holding period of 91 days.
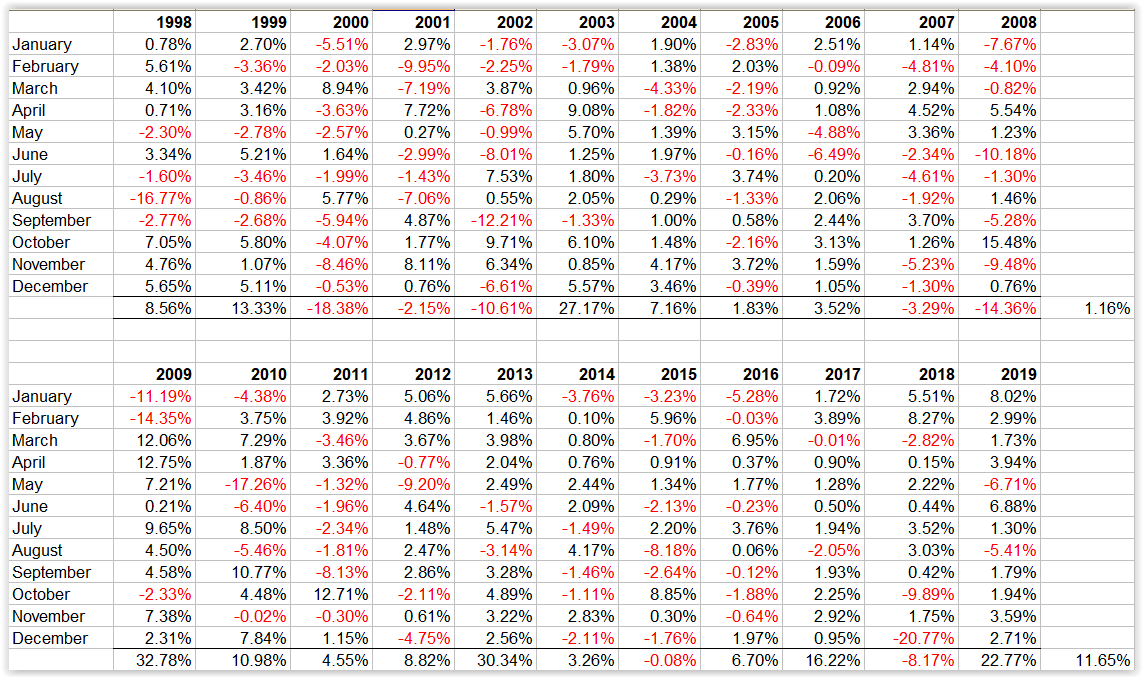
In contrast during the same period, the underlying index and benchmark, the S&P 500, had an average annual return of 7.19% and a maximum drawdown of -56.78% for a Risk Reward Ratio of 0.127.
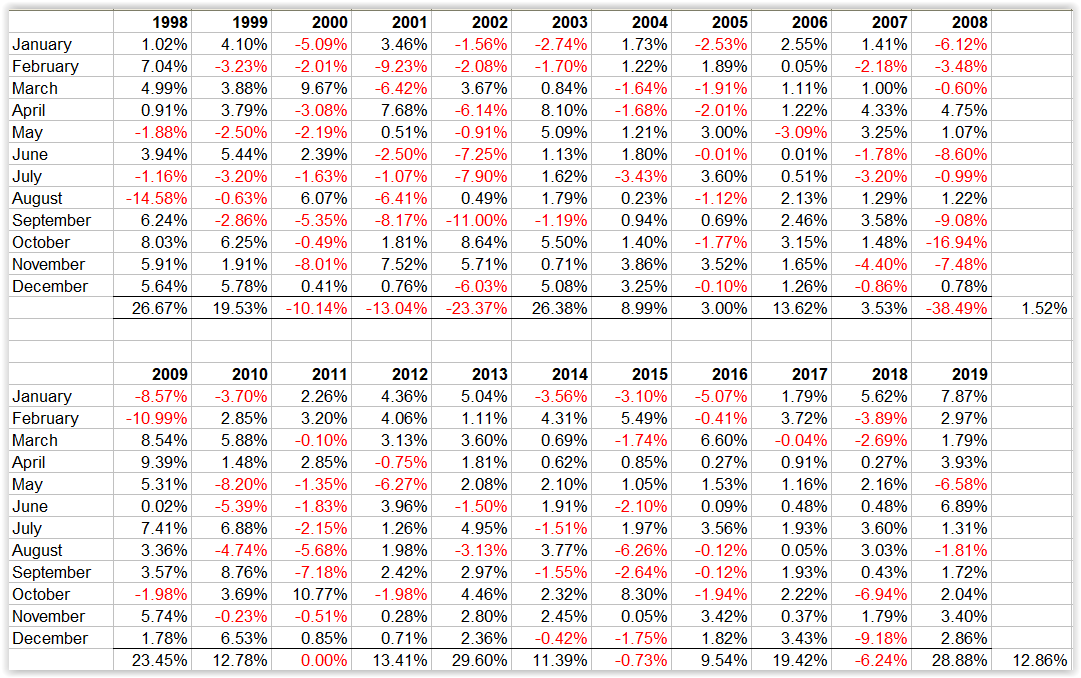
Although 2008 was still a down year, by going short the market, the Index Momentum strategy did significantly better than the straightforward buy and hold approach. The same is true for the other big market drop that came with the tech bubble burst between 2000 and 2002. The S&P 500 lost a total of -46.55% compared to a smaller -31.14% loss for the Index momentum strategy.
The key difference between trading the S&P 500 with the Index Momentum Strategy and the buy and hold approach in the S&P 500 is the Risk Reward Ratio. The Risk Reward Ratio for the Index Momentum strategy is 0.235 compared to 0.127 for the buy and hold approach. Using this metric, the Index Momentum strategy is 1.85x better than the buy and hold approach.
The higher Risk Reward Ratio of the strategy allows us to boost our returns using futures contracts. One of the most popular futures markets, the MES or Micro E-Mini S&P 500 futures tracks the performance of the S&P 500 index. Using today’s MES futures value of 3,500, multiplier of 5 and a margin of $1,200, this translates to a minimum capital requirement of $6,816 and an average annual return of $1,368. Thus, trading this strategy with the MES futures gives us an annual average net return on capital of 20.07%.
The chart below shows hypothetical equity curves for a $6,850 investment in the Index Momentum strategy using the MES futures compared with that for an equivalent buy and hold investment in the S&P 500 over the backtesting period.

It is worth noting that in the above discussion, the monies generated from the Index Momentum strategy were not re-invested in the system. On the other hand, by its nature, a buy and hold approach automatically re-invests any monies that are generated.
Thus one could potentially increase the returns of the Index Momentum system by re-investing some of the monies generated. That said, investing in the Futures Markets requires different considerations than investing in a stock or an ETF. For a more complete discussion between the two approaches, including risk considerations and money management, please read our posts Investing in the Futures Markets and Compounding With Futures.
In conclusion, the Index Momentum strategy can just as easily be applied to other stock market indices such as the Nasdaq 100 and the Russell 2000 or combinations thereof as summarized in the table below :
| Index | Net Annual | Minimum Capital Requirement | Maximum Hist Drawdown | ROC % |
| S&P 500 | $1,368 | $6,816 | -27.32% | 20.07% |
| Russell 2000 | $836 | $3,585 | -21.35% | 23.31% |
| Nasdaq 100 | $2,276 | $9,229 | -29.44% | 24.66% |
| Index Portfolio I | $2,204 | $10,401 | -24.34% | 21.69% |
| Index Portfolio II | $4,480 | $19,629 | -26.04% | 22.82% |
In the above table an index value of 11,000 was assumed for the Nasdaq 100 and a value of $1,800 for the Russell 2000. The Index Momentum Portfolio I consists of the S&P 500 and the Russell 2000 traded together as one portfolio. The Index Momentum Portfolio II consists of the S&P 500, Nasdaq 100 and Russell 2000 indices traded together as one portfolio. Of course, the strategy can also be traded with the regular E-Mini contracts which are 10x the size of the mico contracts. Capital requirements and net annual returns are then 10x those listed in the above table.