One way to diversify your portfolio and hedge yourself against the ups and downs of the stock market is to look for instruments that are not correlated with the equity markets. In particular, if an instrument is inversely correlated with the market, then this instrument should go up when the equity market goes down.
One such instrument is Volatility represented by the Volatility Index or VIX. Also known as the Fear Index, the VIX is a popular measure of the implied volatility of the S&P 500 index options, calculated and published by the Chicago Board of Options Exchange (CBOE). Since its introduction in 1993, the VIX index has been considered by many to be the world’s premier barometer of investor sentiment and market volatility.
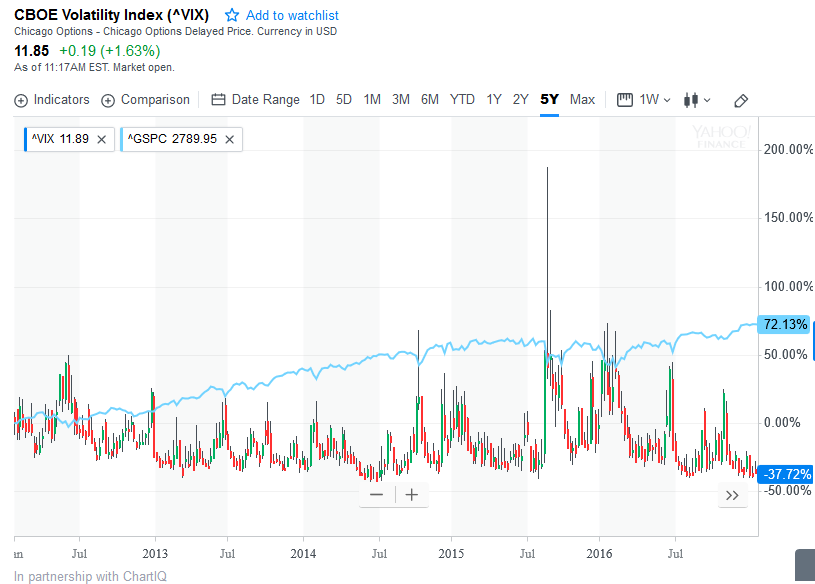
Although the VIX is inversely correlated with the S&P 500 index, it cannot be traded directly. The VIX has no tradeable products such as the SPY ETF for the S&P 500 index. To take a position in the VIX one has to take a position in VIX Futures contracts and options.
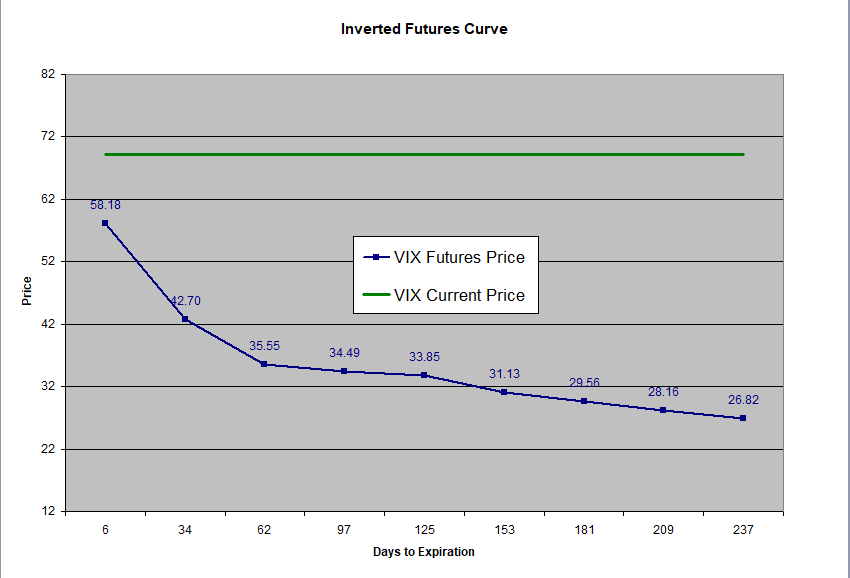
The prices of VIX futures contracts can be higher or lower than current VIX prices depending on whether the market expects volatility in the future to be higher or lower than current levels. In a normal environment, future volatility values tend to be higher than current values. This typically occurs in a lower or normal volatility environment. In an inverted environment, future volatility values tend to be lower than current values. The latter scenario typically occurs in a high volatility environment such as that of 2008.
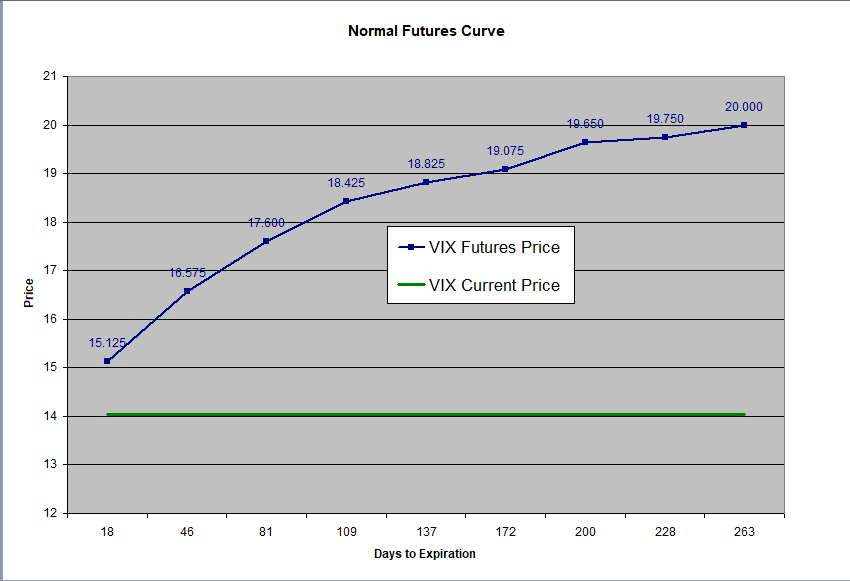
As one gets closer to expiry, the price of a futures contract must agree with that of the spot price. This means that in a normal market environment, the higher priced futures values must come down or fall to agree with the spot VIX price as expiration day approaches. The VX Short strategy takes advantage of these price decay characteristics by identifying the opportune times to be short the VIX futures. Once a position is opened, stop losses are put in place to exit the position if the market turns against it.
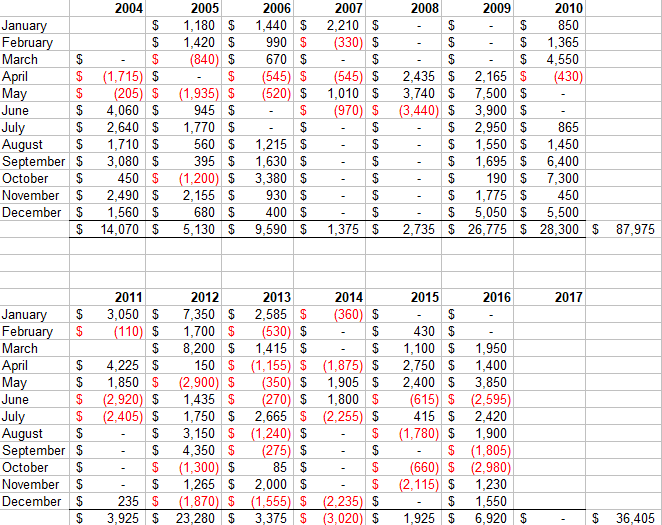
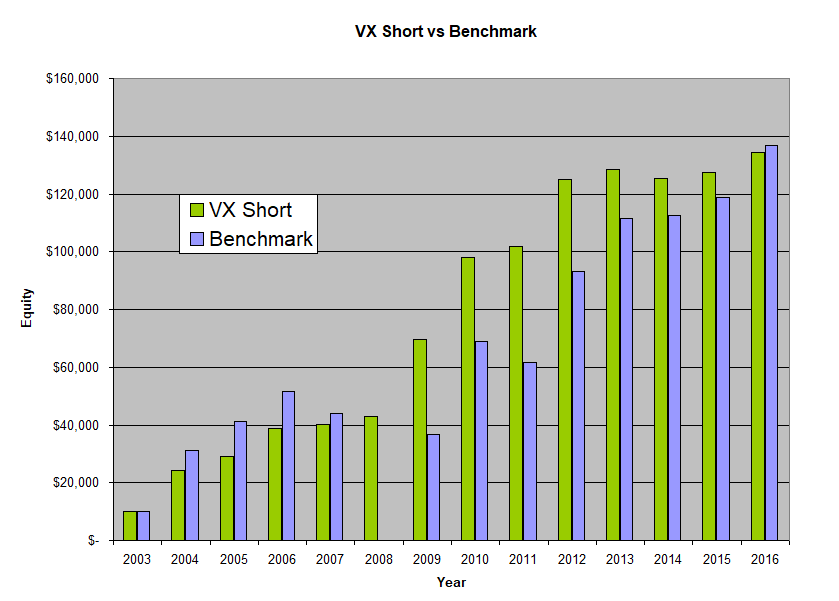
The strategy was backtested for a period of 13 years, from 2004 to 2016 and had an average annual return of $9,568 with a maximum drawdown of -$4,299. Using today’s multiplier of 1,000 and margin requirement of $9,900 we get a minimum capital requirement of $14,500. This translates into an average annual return of 65.98% with a maximum drawdown of -29.65% for a Risk Reward ratio of 2.23. The strategy has around 15 trades per year with an average hold of 16.67 trading days.
As illustrated in the table below the strategy is in the market only about half of the time. It does a very good job of identifying periods of potential market trouble such as the great recession of 2008 and the turbulent times of 2011. We set out to find a strategy that goes up when the market goes down. Instead we’ve found a strategy that sits out when the market goes down and makes its move when conditions are favorable.
The benchmark for this strategy would be a short position in the VX futures. (This is somewhat similar to shorting the VXX ETN although the latter uses both front and back month contracts). During the same period this approach would have generated an average annual return of $9,753 with a maximum drawdown of -$79,590. Using today’s multiplier of 1,000 and margin requirement of $9,900 this approach thus requires a minimum capital requirement of $89,500. Thus the benchmark had an average annual return of 10.90% and a maximum drawdown of -88.93% for a risk reward ratio of 0.12.

Using the risk reward ratio as a comparison metric, the VX Short strategy is 18.5 times better than just going short the benchmark since it prevents the major drawdowns.
It is very important to note that although this strategy uses stop losses to exit the position if the market moves against it, there is always a possibility that a loss will be incurred that is bigger than the loss as limited by the stop. This is because stops do nothing when the markets are closed. If the market gaps beyond the stop on the next open, the stop will be triggered but the loss is going to be greater than the stop. In addition, in fast moving markets the actual trading price might be significantly different than the stop price.
It is also worth noting that in the above discussion, the monies generated from the VX Short strategy were not re-invested in the system. On the other hand, by its nature, a sell and hold approach automatically re-invests any monies that are generated.
Thus one could potentially increase the returns of the VX Short system by re-investing some of the monies generated. That said, investing in the Futures Markets requires different considerations than investing in a stock or an ETF. For a more complete discussion between the two approaches, including risk considerations and money management, please read our posts Investing in the Futures Markets and Compounding With Futures.