One drawback of the NQ Pullback I Strategy is that it takes into consideration the period from 2001 to 2003 which included the Dotcom bubble burst.
During the 1990s a lot of venture funding capital went into technology companies with the hope that one day these would turn a profit. This included a lot of speculation and when a lot of these companies folded and most of these profits failed to materialize the Nasdaq 100 index came crashing down with them. From its peak of 4691.61 in March 24, 2000 it dropped to a low of 815.40 on October 4, 2002 for an -82.6% drop in value.
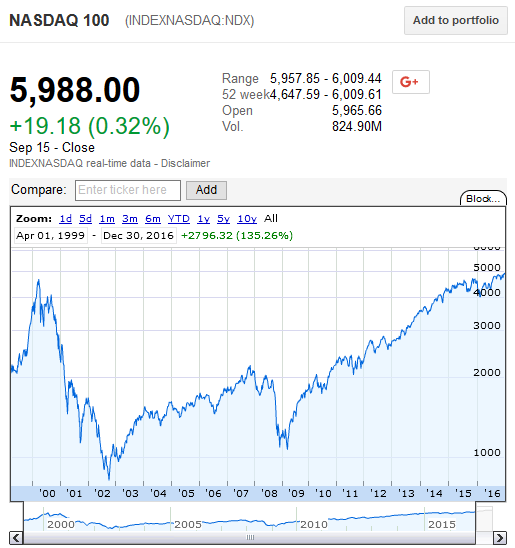
Although one can never say with certainty if a situation like this is going to happen again in the future, the companies included in the index today are much more viable than those listed in 2000 and the years leading up to it. Thus, a market downturn is not likely to be as bad. For example, during the financial meltdown of 2008 the Nasdaq 100 index went from a peak of 2213.86 on November 2nd, 2007 to a low of 1064.70 on March 6th 2009 which represents a drop of -51.9%.
Including these extreme case scenarios in the backtesting modeling process offers the advantage of having a strategy that is better suited for market crashes. However this comes at a cost as more common market conditions are not fully taken advantage of.
To mitigate this effect one can exclude extreme periods from the modeling process and give more weighting to more recent market conditions. This was done by backtesting the strategy over the last 11 years, from 2006 to 2016. Doing so one generates different strategy parameters that are more suited to moderate market conditions. We use these parameters for the NQ Pullback II.
During this period, from 2006 to 2016, the NQ Pullback II strategy had an average annual return of 9.89% and a maximum drawdown of -7.98% for a Risk Reward Ratio of 1.24. It averaged 17.9 trades a year with an average hold of 3.34 days.
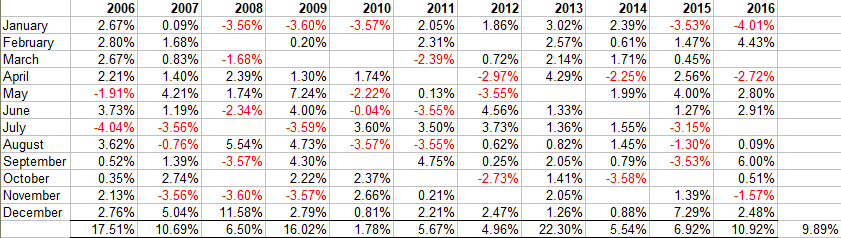
As seen in the above tables, the strategy never had a loosing year posting good returns in down years such as 2008 and even better returns in bull market years such as 2013.
During the same period, from 2006 to 2016 the benchmark had an average annual return of 13.01% and a maximum drawdown of -53.71% for a Risk Reward Ratio of 0.24. Over the backtesting period, the NDX had one loosing year, and a success ratio of 59.8% up months.
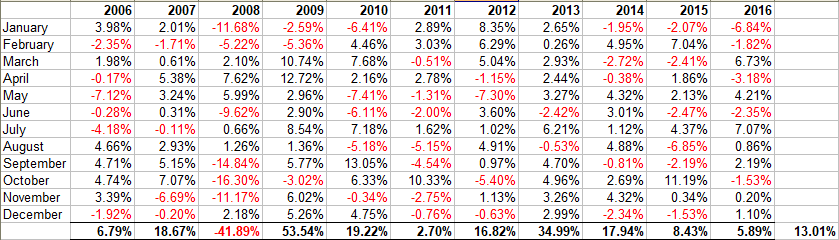
Using the Risk Reward ratio as a comparison metric, the NQ Pullback II strategy is about 5.2 times better than a buy and hold approach in the Nasdaq 100 index. This is achieved by limiting the drawdowns and thus maximizing the Return on Capital.
The high Risk Reward ratio of the strategy allows us to boost our returns using futures contracts. To do this we apply the strategy to the E-mini Nasdaq 100 Futures denoted by the symbol NQ. Trading this strategy with the NQ futures gives us an annual average net return of 79.9% and a maximum drawdown of -64.5%. The Risk Reward ratio remains constant at 1.24.
Using today’s NQ futures value of 6,600.00, multiplier of 20 and a margin of $5,800, this translates to a minimum capital requirement of $16,334 and an average annual return of $13,055. This also equates to a dollar return of $8,580 for 2008 and $29,436 for 2008. Using the current allocated capital of $16,334 this implies a return on allocated capital of 52.53% in 2008 and 180.21% in 2013.
The chart below shows hypothetical equity curves for a $10,000 investment in the NQ Pullback I strategy compared with that for an equivalent investment in the NDX over the backtesting period.
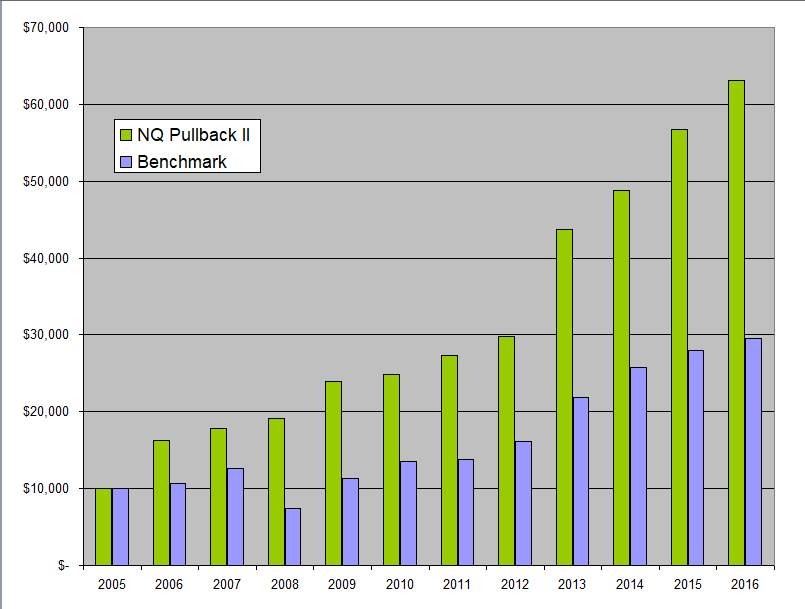
It is worth noting that in the above discussion, the monies generated from the NQ Long I strategy were not re-invested in the system. On the other hand, by its nature, a buy and hold approach automatically re-invests any monies that are generated.
Thus one could potentially significantly increase the returns of the NQ Long I system by re-investing some of the monies generated. That said, investing in the Futures Markets requires different considerations than investing in a stock or an ETF. For a more complete discussion between the two approaches, including risk considerations and money management, please read our posts Investing in the Futures Markets and Compounding With Futures.
Since the optimization and backtesting was done from 2006 to 2016, 2001 to 2005 constitutes an out of sample data set. It is thus instructive to look at how the NQ Pullback strategy would have performed from 2001 to 2005. This is illustrated in the table below.
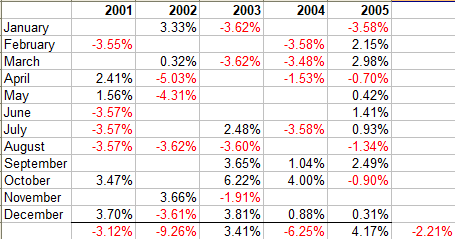
The above table shows that the strategy would have lost money over this period. This is not a surprise since the market conditions were very different during this time than during the optimization period. Results like these are a fresh reminder that when developing quantitative strategies it is of utmost importance to look at all different market situations. If not, one cannot have any confidence in the strategy results.
The question then becomes, which strategy should one use NQ Pullback I or NQ Pullback II? There are three possible answers to this question:
- If you think that another 2001 scenario is unlikely then you might favor NQ Pullback II. This strategy had a good year in 2008 which was a strong down market and took full advantage of 2013 which was a strong up-trending market.
- On the other hand, if you think that the recent bull market is close to being done and we might be in for another downturn soon, then you might prefer NQ Pullback I as it is a more conservative strategy and will do better in adverse market conditions.
- Finally, if like me you don’t like to guess as to what the market is going to do next, then you would want to allocate capital to both NQ Pullback I and NQ Pullback II. That way, no matter what the market does you’ll be well positioned to take advantage of it.