A lot of people would like to find a strategy that makes money when the equity markets fall. How great would it be if your portfolio can have a positive year during a recession such as that of 2008? This is possible if one deploys other strategies besides buy and hold.
When a market is going up or down it typically does so in a non linear manner forming waves or cycles along the way. One can find short term downturns in a longer term uptrend market and short term upturns in a longer term downtrend market. Just like the TF Pullback , the NQ Pullback I strategy finds value by identifying short term downtrends in a longer term up-trending market.
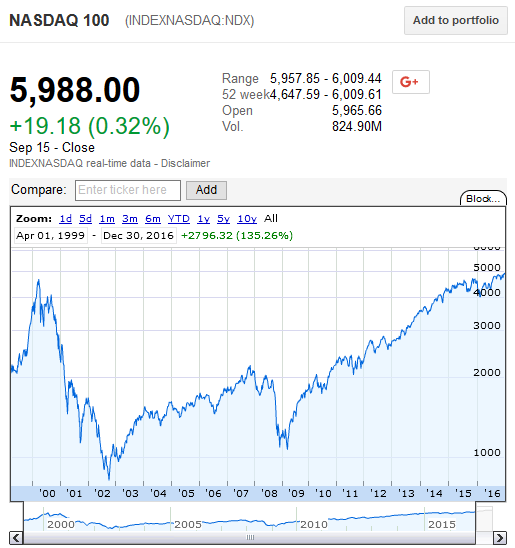
This strategy is applied to the Nasdaq 100 Index or NDX which includes 100 of the largest US and international companies listed on the Nasdaq stock market based on market capitalization. This index is frequently used to manage technology exposure due to its heavy technology sector weighting.
Backtesting was done for a period of 16 years, from 2001 to 2016. This included the technology bubble burst of 2000 as well as the financial meltdown of 2008. During this period the strategy had an average annual net return of 6.56% and a maximum drawdown of -7.09% for a Risk Reward ratio of 0.93. The strategy averaged 10.82 trades per year with an average holding period of 3.43 days.
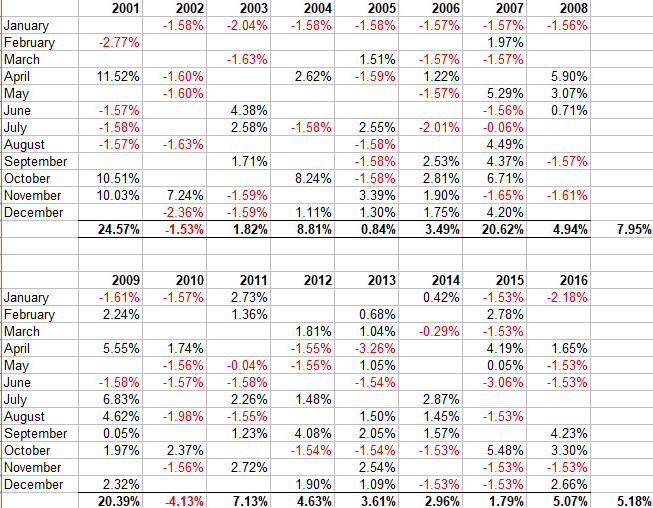
As can be seen in the above tables, despite having two loosing years, this strategy held up well during the huge market crashes of 2001 and 2008 with a percentage index return of 24.57% and 4.94% respectively.
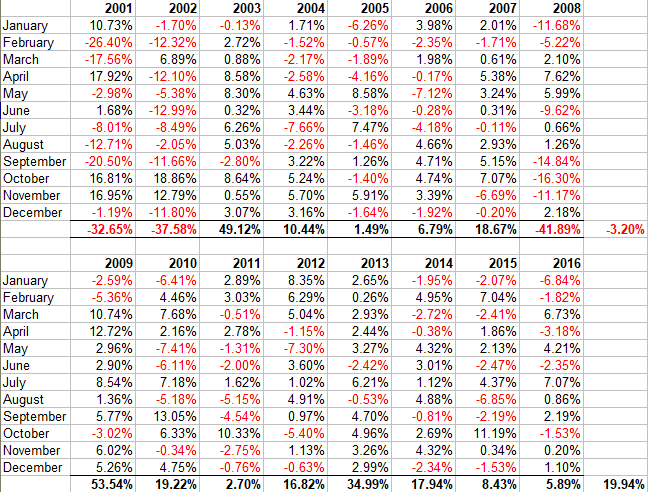
In contrast during the same time period, the underlying benchmark, the NDX, had an average annual return of 8.37% and a maximum drawdown of -70.53% for a Risk Reward ratio of 0.12. Over the backtesting period, the NDX had 3 loosing years and a success ratio of 52.7% up months. Most importantly, as illustrated in the Nasdaq 100 chart above, as of the end of 2016, the index had just about reached the same highs as it had reached 16 years earlier in 2000.
Thus, if we use the Risk Reward factor to compare the NQ Pullback I strategy with the benchmark, the NQ Pullback I strategy is 7.8 times better. This is achieved by limiting the drawdowns and thus maximizing the Return on Capital.
The high Risk Reward ratio of the strategy allows us to boost our returns using futures contracts. To do this we apply the strategy to the E-mini Nasdaq 100 Futures denoted by the symbol NQ. Trading this strategy with the NQ futures gives us an annual average net return of 57.15% and a maximum drawdown of -61.74%. The Risk Reward ratio remains constant at 0.93.
Using today’s NQ futures value of 6,600.00, multiplier of 20 and a margin of $5,800, this translates to a minimum capital requirement of $15,159 and an average annual return of $8,663. This also equates to a dollar return of $32,432.40 for 2001 and $6,520.80 for 2008. Using the current allocated capital of $15,159 this implies a return on allocated capital of 112.67% in 2001 and 42.76% in 2008.
The chart below shows hypothetical equity curves for a $10,000 investment in the NQ Pullback I strategy compared with that for an equivalent investment in the NDX over the backtesting period.
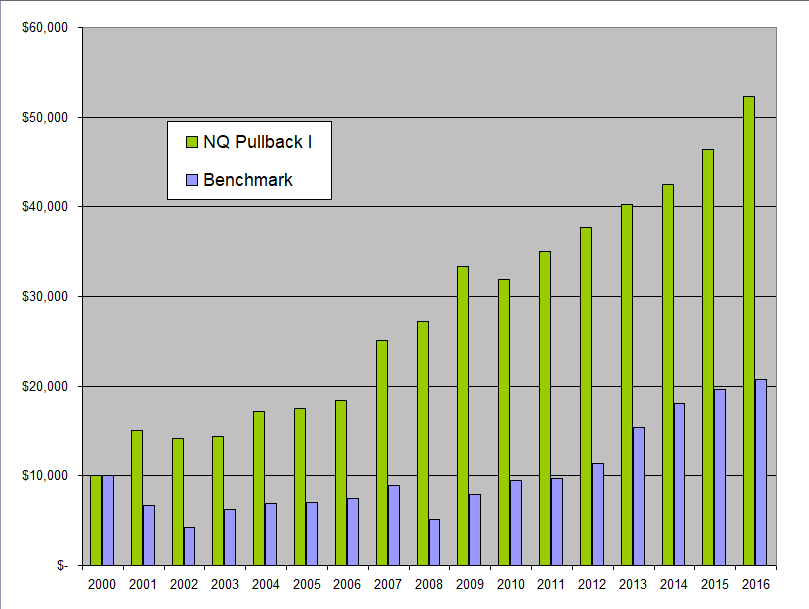
It is worth noting that in the above discussion, the monies generated from the NQ Pullback I strategy were not re-invested in the system. On the other hand, by its nature, a buy and hold approach automatically re-invests any monies that are generated.
Thus one could potentially significantly increase the returns of the NQ Pullback I system by re-investing some of the monies generated. That said, investing in the Futures Markets requires different considerations than investing in a stock or an ETF. For a more complete discussion between the two approaches, including risk considerations and money management, please read our posts Investing in the Futures Markets and Compounding With Futures.