As the old saying goes, the two main driving forces behind market moves are greed and fear. In particular the market tends to come down fast in the face of bad news only to recover some or all of its losses after the news has been digested and the emotions subside.
The ES Pullback strategy exploits this market characteristic by buying the market when it identifies good value. This strategy was applied to the S&P 500. Widely regarded as the best single gauge of large-cap U.S. equities, the S&P 500 index captures approximately 80% of available market capitalization.
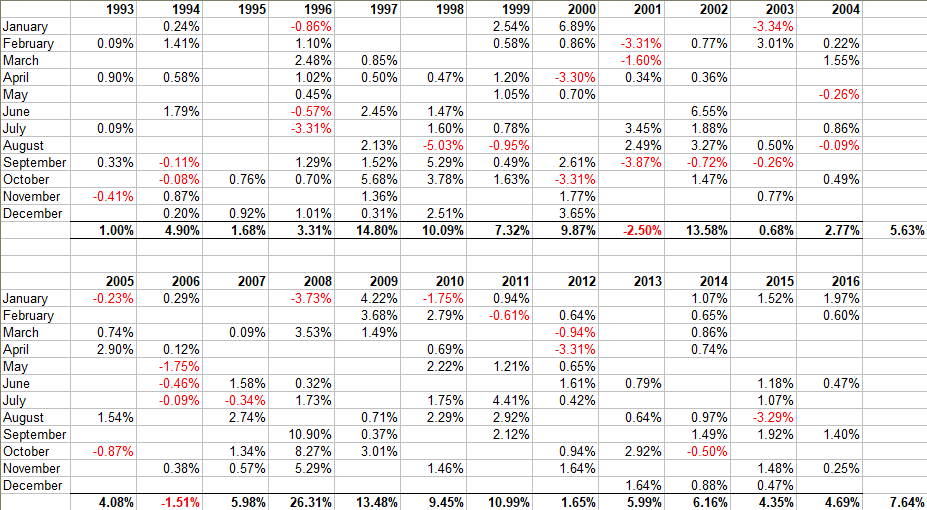
The strategy was backtested for a period of 24 years, from 1993 to 2016, and showed an average annual return of 6.63% with a maximum drawdown of -5.78% for a Risk Reward of 1.15. The strategy has around 10 trades per year with an average holding period of 1.75 days. For the months it had an open position, it showed a success rate of 80.37%.
The strategy only had two losing years over the backtesting period. In addition, the strategy did very well in the highly volatile years from 2008 to 2011. with 2008 being it’s best year ever.
In contrast during the same period, the underlying index and benchmark, the S&P 500, had an average annual return of 8.63% and a maximum drawdown of -56.78% for a Risk Reward ratio of 0.15. Over the backtesting period, the S&P 500 had four big loosing years and three breakeven or small loss years.

Thus, if we use the Risk Reward factor to compare the two strategies the ES Pull Back strategy is about 7.6 times better than the buy and hold approach as it generates comparable returns with significantly smaller drawdowns. The high Risk Reward ratio of the strategy allows us to boost our returns using futures contracts.
One of the most popular futures markets, the ES or E-Mini S&P 500 futures tracks the performance of the S&P 500 index. Trading this strategy with the ES futures gives us an annual average net return of 64.68% and a maximum drawdown of -56.44%. The Risk Reward ratio remains constant at 1.15.
Using today’s ES futures value of 2,600.00, multiplier of 50 and a margin of $5,800, this translates to a minimum capital requirement of $13,325 and an average annual return of $8,619. This also equates to a dollar return of $12,831 for 2000 and $34,203 for 2008. Using the current allocated capital of $13,325 this implies a return on allocated capital of 96.29% in 2000 and 156.68% in 2008.
The chart below shows hypothetical equity curves for a $10,000 investment in the ES Pullback strategy compared with that for an equivalent investment in the SPX over the backtesting period.
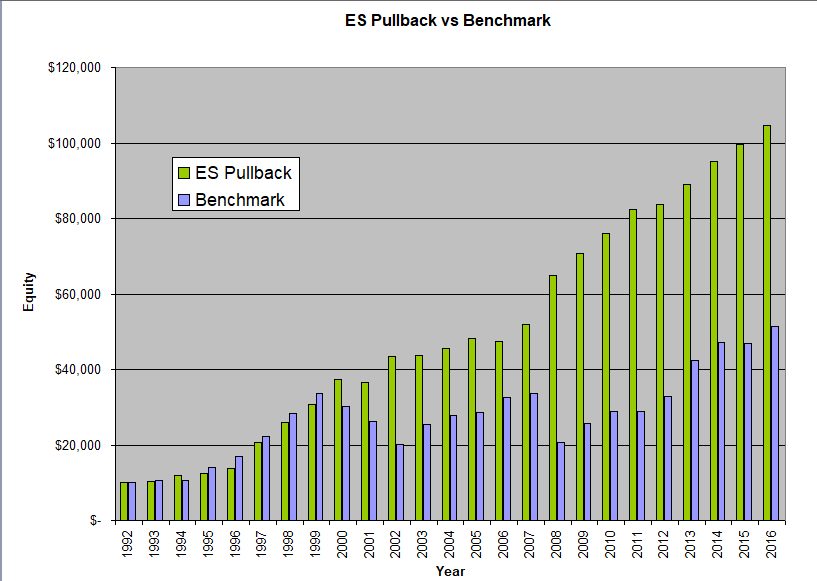
It is worth noting that in the above discussion, the monies generated from the ES Pull Back strategy were not re-invested in the system. On the other hand, by its nature, a buy and hold approach automatically re-invests any monies that are generated.
Thus one could potentially increase the returns of the ES Pull Back system by re-investing some of the monies generated. That said, investing in the Futures Markets requires different considerations than investing in a stock or an ETF. For a more complete discussion between the two approaches, including risk considerations and money management, please read our posts Investing in the Futures Markets and Compounding With Futures.